The topic of reverse logistics, or, more specifically, returns management – keeps many executives up at night. An efficient, cost-effective approach to returns is vital in the Amazon Prime era, where easy, fast, and free returns have become the expectation of consumers everywhere.
Obviously, not every company operates on the same level as Amazon. Many businesses are even charging restocking and processing fees to customers who choose to return their purchases.
This led us to wonder:
- What separates companies like Amazon from everyone else in the returns management space? Are things like its size, product volume, number of employees, and technology the primary reasons it can offer fast and free returns?
- What costs should be considered, what tools are most critical, and what approach should companies take to ensure returns management success?
- What technology is critical for returns management, and what should VARs consider in conversations with reverse logistics partners?
These questions created the foundation of a survey of executives in apparel, eCommerce, electronics, retail, and the transport/logistics industries.
Let’s get into what we uncovered.
The Methodology
We employed a third-party data collection agency to gather survey responses from 100 retail & supply chain executives in the United States, across the apparel, eCommerce, electronics, retail, and transport & logistics industries.
The respondents were recruited through a global B2B research panel and invited via email to complete the survey.
Our Findings
The first thing we wanted to do was ensure we were talking to the right people. We focused entirely on industries that would commonly work with returns management. Any person who was not a high-level (Director or above), and who did not manage returns, was automatically excluded.
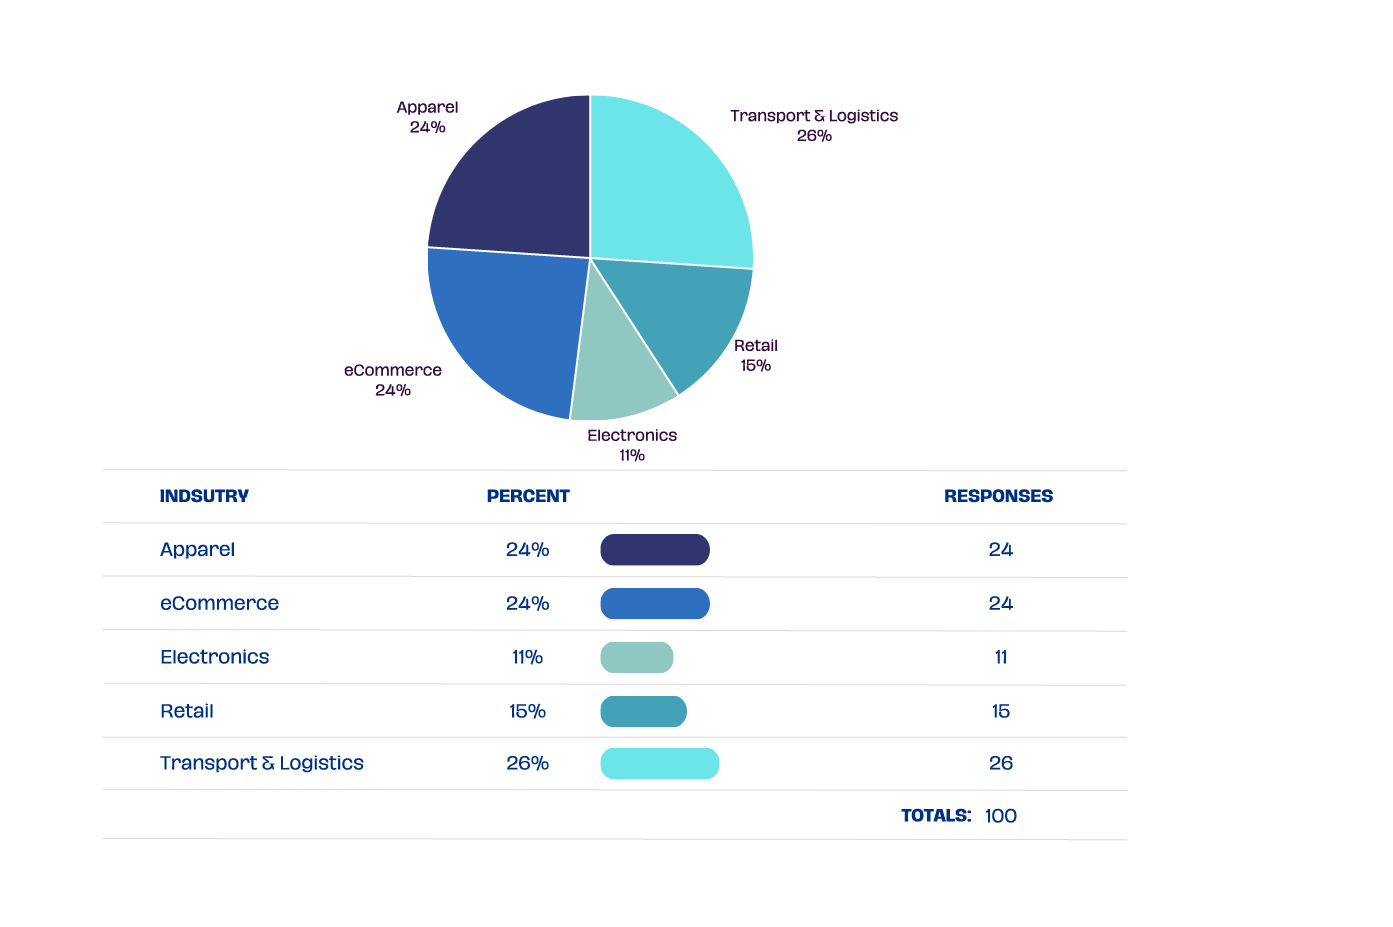
Question 1:
In Which Industry Do You Work?
75% of our respondents work in Apparel, eCommerce, or T&L.
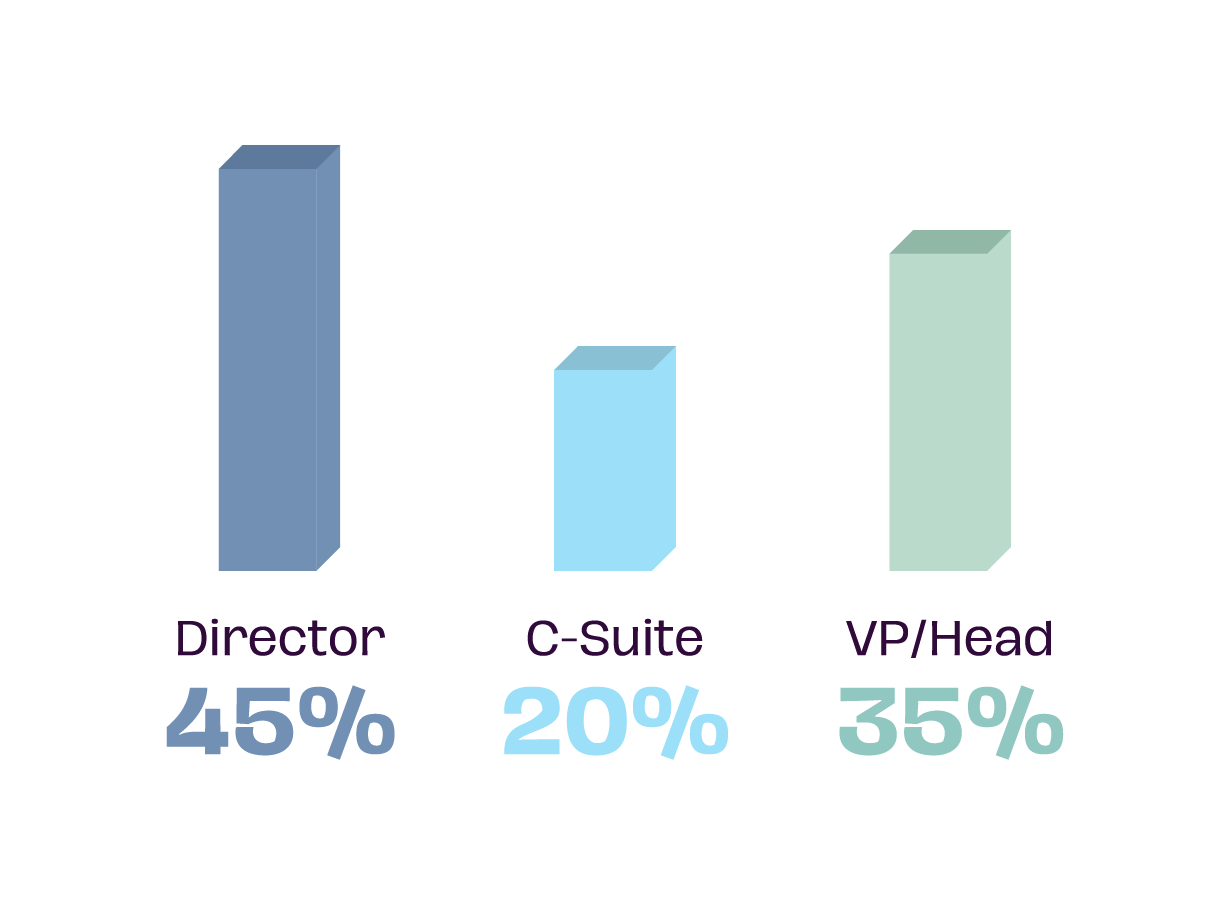
Question 2:
Which of the following most closely matches your job seniority?
High-level executives were our primary target, as they are the ones who are most likely to not only manage the day-to-day returns management processes, but they are also the ones who make technological buying decisions.
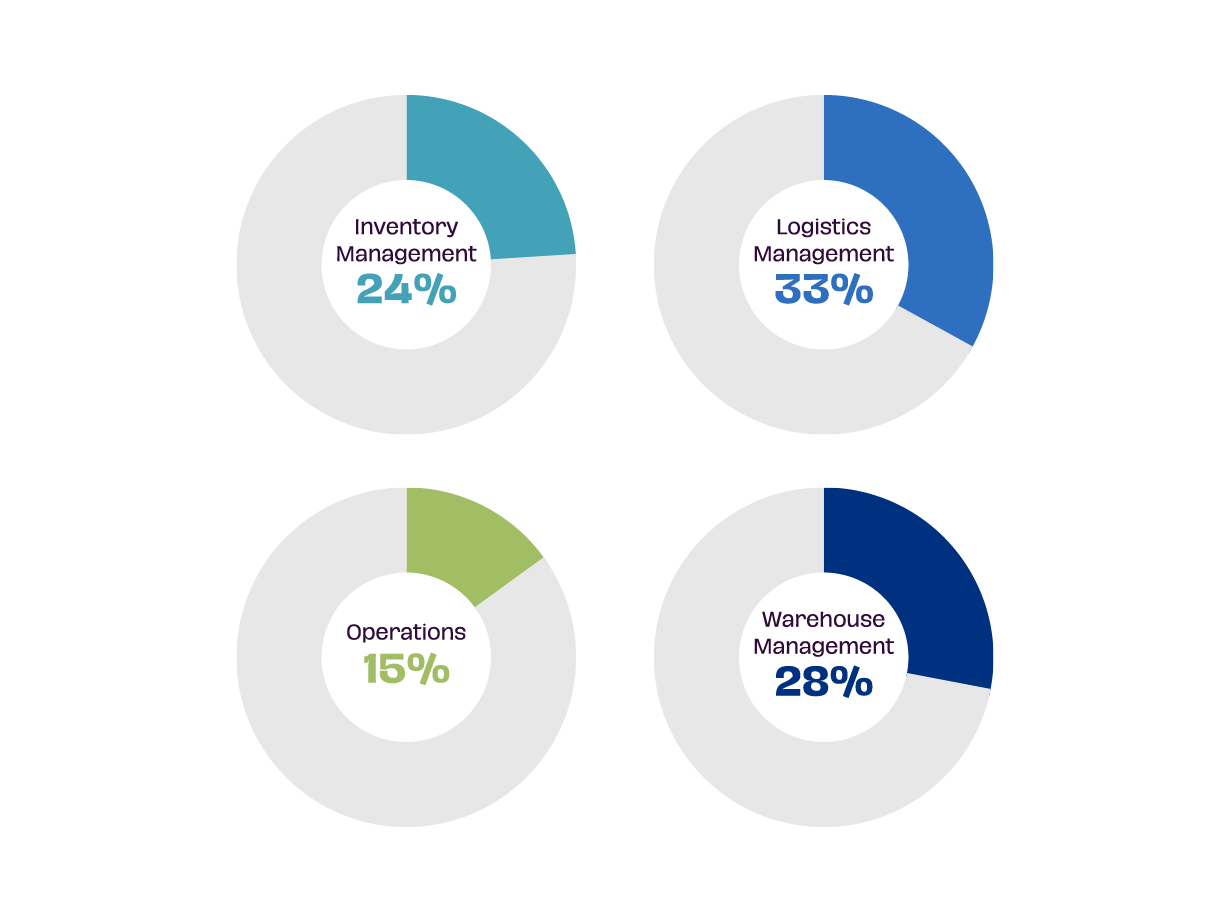
Question 3:
Which of the following most closely matches your role?
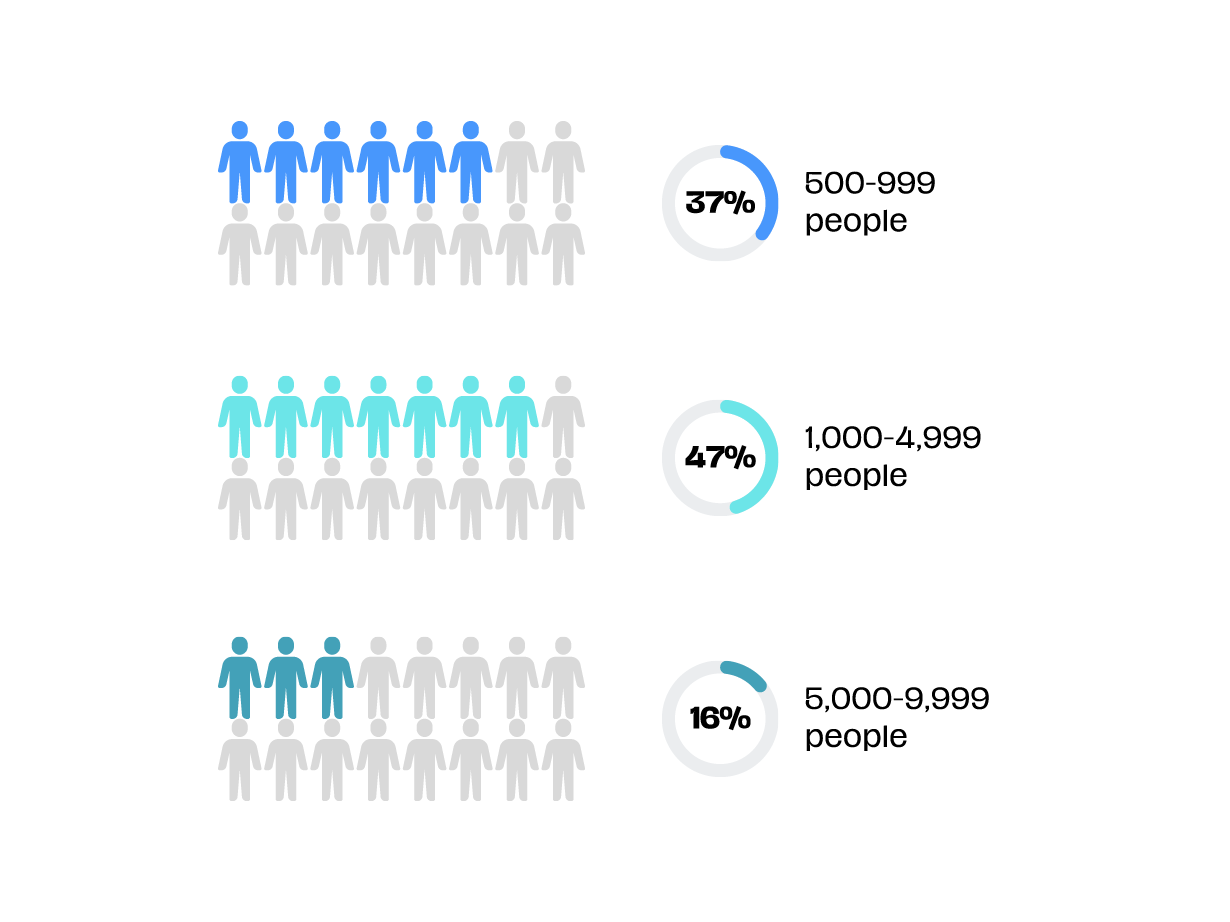
Question 4:
What is your company size (all locations)?
Our goal was to learn from mid to large-sized companies that handle a large volume of returns and have the resources to incorporate a great deal of technology in their operations.
Question 5:
When considering the volume of goods your facility handles daily, which statement best describes your environment?
We focused on facilities that handle substantial volumes of goods daily but did not exclude smaller operations. 79% of those surveyed considered their operations average or large-scale. 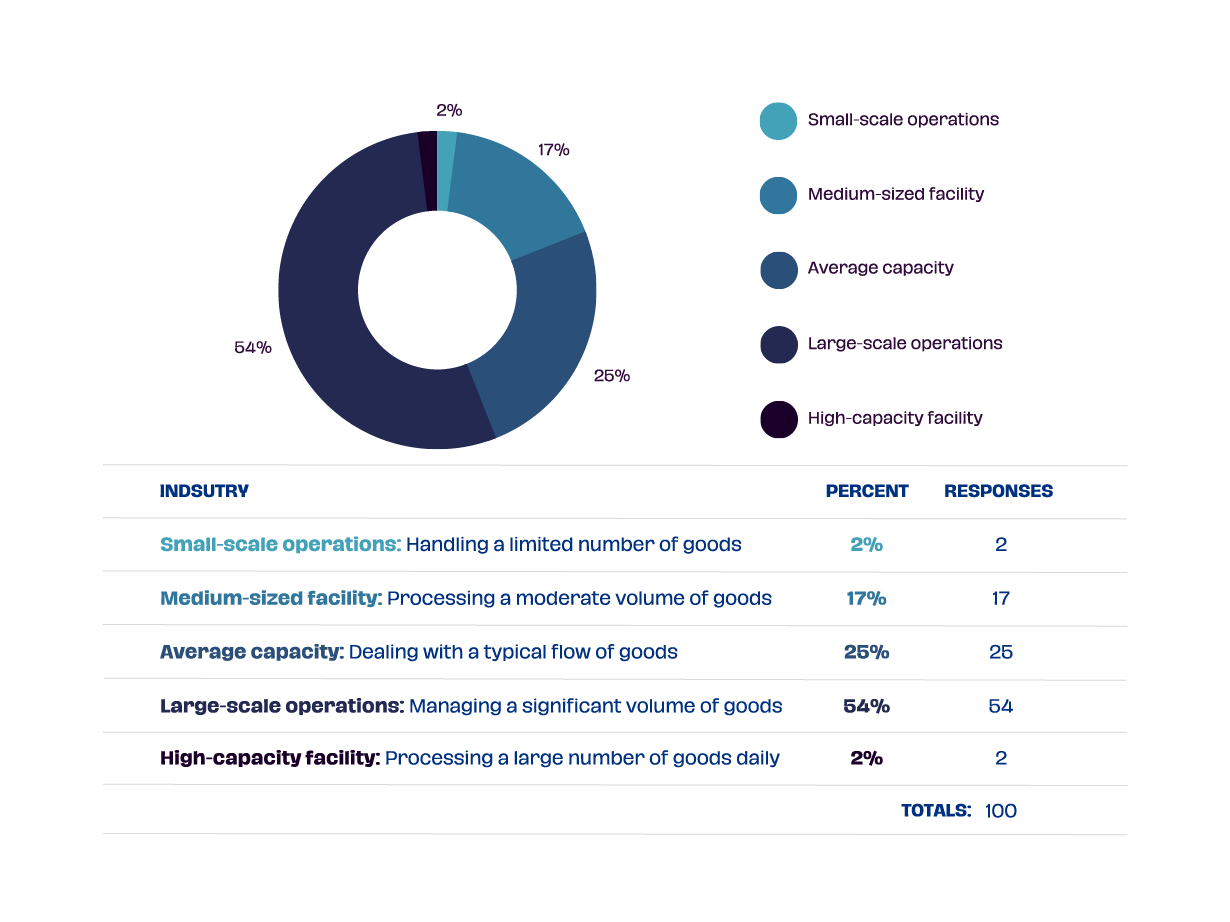
Question 6:
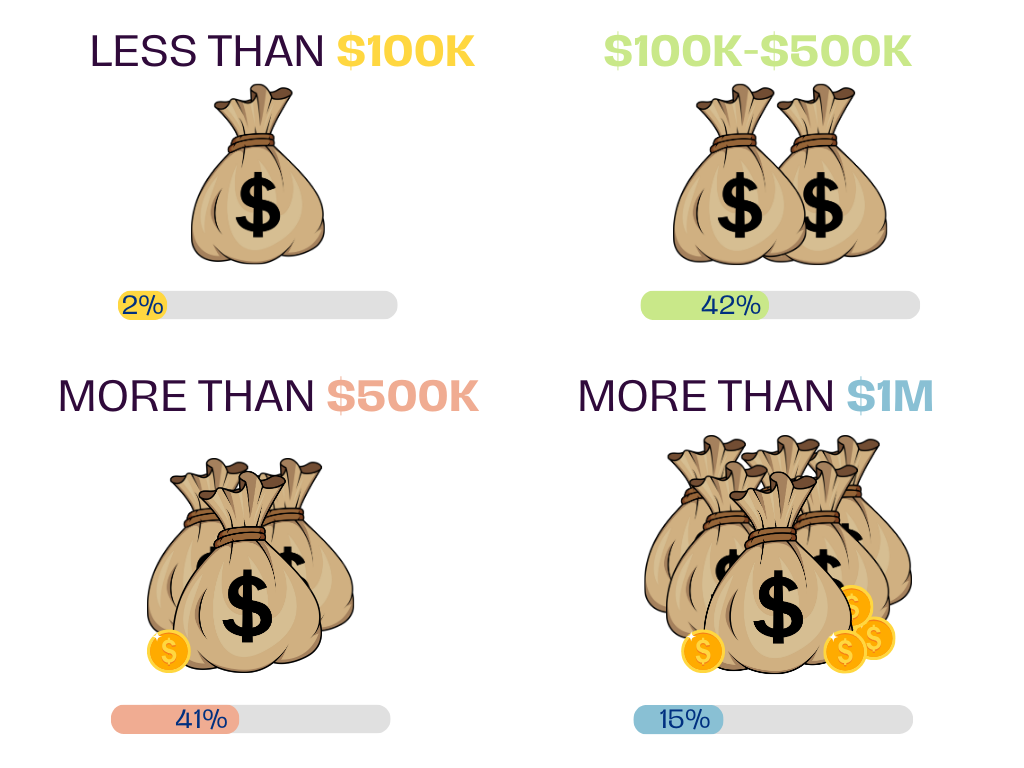
What is the total value of returns processed annually in your organization?
Question 7:
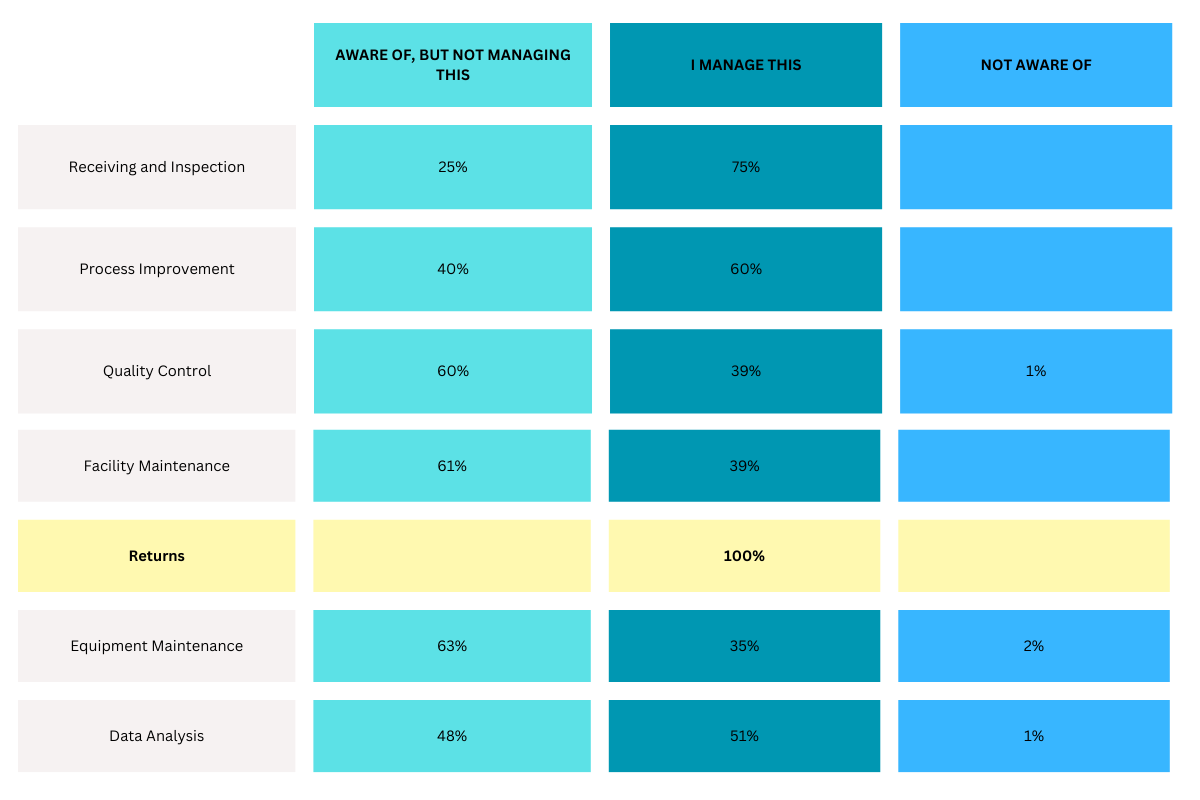
Which of the following responsibilities do you have?
Individuals who did not manage returns were automatically disqualified from the survey, so 100% of our responses are from people involved in reverse logistics. We also wanted to learn the extent to which these managers are involved in other aspects of returns. The people who wear multiple hats are more likely to utilize and understand every piece of hardware, software, and labor involved in their respective businesses.
75% of the respondents manage receiving and inspection, 60% manage process improvement, 51% manage data analytics, 39% manage quality control, and an equal 39% manage facility maintenance.
Where did it go?
Our goal with the next two questions was to determine if there is possibly a correlation between items
that go missing and the processes, people, and/or technology that is involved in tracking returned items.
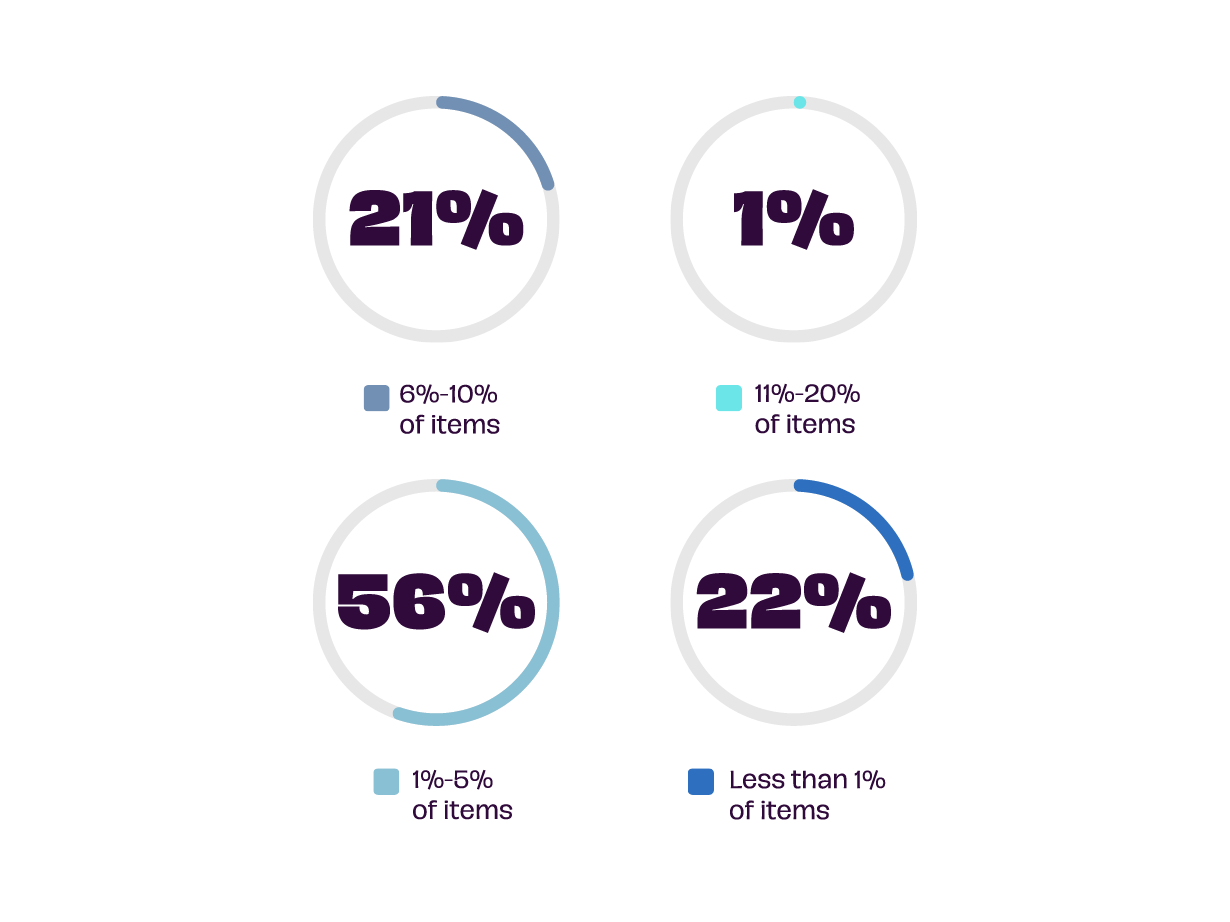
Unsurprisingly, a good percentage of returned items go missing every year.
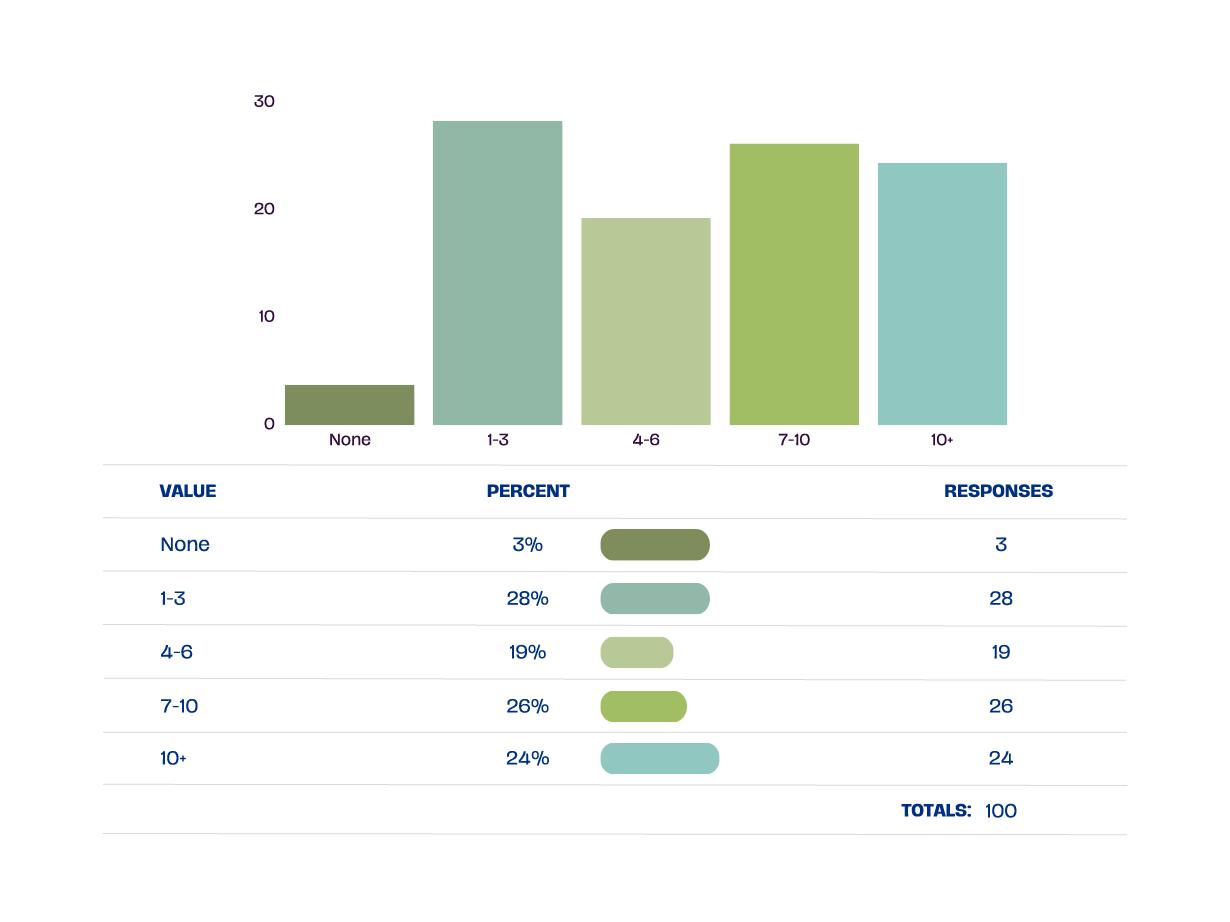
Question 8:
Approximately what percentage of items go missing in the returns process each year?
Question 9:
What do you primarily attribute loss to?
Somewhat surprisingly, theft wasn’t a major contributor to overall losses, with most respondents (70%) citing human error or items being damaged or lost in transit as their primary reasons for returns loss. 14% of respondents cited software systems as a factor in the loss, while another 13% cited technology failure.
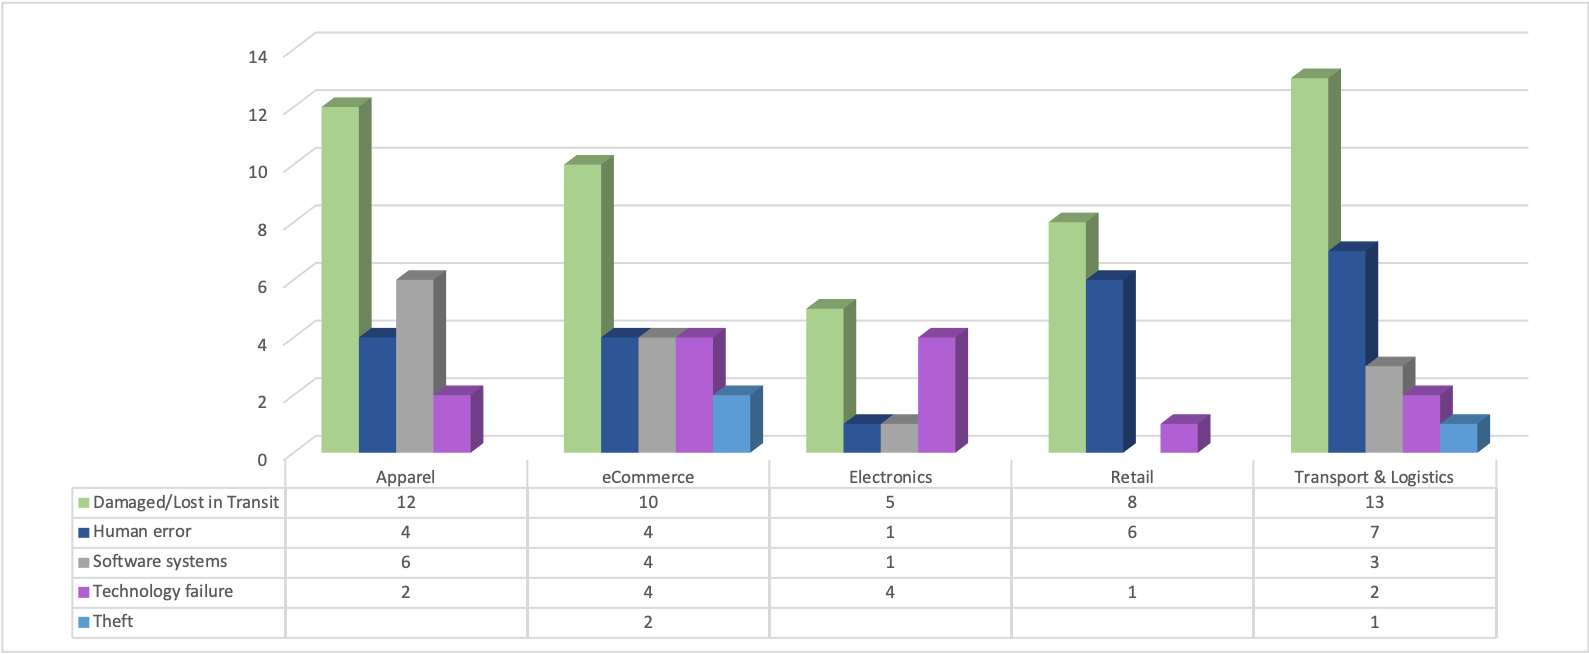
A few quick observations from this data:
- Consistent Transit Challenges: Damaged or lost items during transit emerged as a prevalent issue across all industries, indicating a consistent vulnerability in supply chain logistics.
- Human Error Across the Board: Human error was a significant concern in most sectors, with varying frequencies. It was reported in the Apparel, eCommerce, Retail, and Transport & Logistics industries, highlighting the commonality of internal oversights.
- Technology Challenges: Technology-related problems were reported in the Apparel, eCommerce, Electronics, and Transport & Logistics sectors.
- Rare Incidents of Theft: Surprisingly, incidents of theft were infrequent, reported only in the eCommerce and Transport & Logistics industries.
Question 10:
Do you have back-and-forth movement throughout your facility?
.png)
Back-and-forth movement is common in warehousing. Moving from one station to grab a handheld barcode scanner, moving to another station for label printing, moving to another to check a computer’s inventory, etc.
With this question, we wanted to see how respondents feel this movement affects their returns management processes.
While 96% of respondents reported having back-and-forth movement in their facilities, a majority (36%) said it is of no consequence to their accuracy or efficiency in managing returns, 34% seemed to think their back-and-forth movement is actually a positive thing, and 26% did feel their back-and-forth movement negatively contributed to their accuracy and efficiency.
This question yielded interesting results, as one might expect unnecessary movements to be more largely perceived as negative.
Question 11:
Which devices are you using in your returns management?
By far, the most prevalent devices used across respondents were handheld barcode scanners (68% use hourly), label printers (63% use hourly), tablets (53% use daily), handheld mobile computers (44% use hourly), and mobile carts that are equipped with various devices (60% use daily).
Still prevalent, on a smaller scale, were things like RFID readers, RFID tags, and RFID-encoding printers.
.png)
Question 12:
On a Scale of 1-5, with 5 being the most critical, which aspects of your IT infrastructure are the most critical to your returns management process?
.png)
Question 13:
How much has your company invested in budget, staff, and technology to handle the returns process?
It seems most of the managers represented in this survey are mostly satisfied with their companies’ investments in the returns process, with a fair percentage (32%) stating that they invest slightly more than needed. Still, there is apparently room for improvement, with 26% of respondents saying their respective companies have invested slightly less than needed, and only one respondent saying their company invested a lot less than needed.
.png)
While most respondents said their companies are making appropriate investments in their return management processes, there are still pockets within each sector where improvements can be made, particularly in the apparel, eCommerce, and Transport & Logistics industries. VARs who address these gaps, and help implement appropriate technological resource allocation, will come out ahead in the goal to enhance overall operational effectiveness and customer satisfaction.
Question 14:
How satisfied are consumers with the overall return process?
Ultimately, if a majority of a business's customers aren’t “very satisfied,” that means there is room for improvement. Most of our participants responded that their customers were neutral (17%) and somewhat satisfied (63%).
.png?width=1024&height=693&name=Q18(2).png)
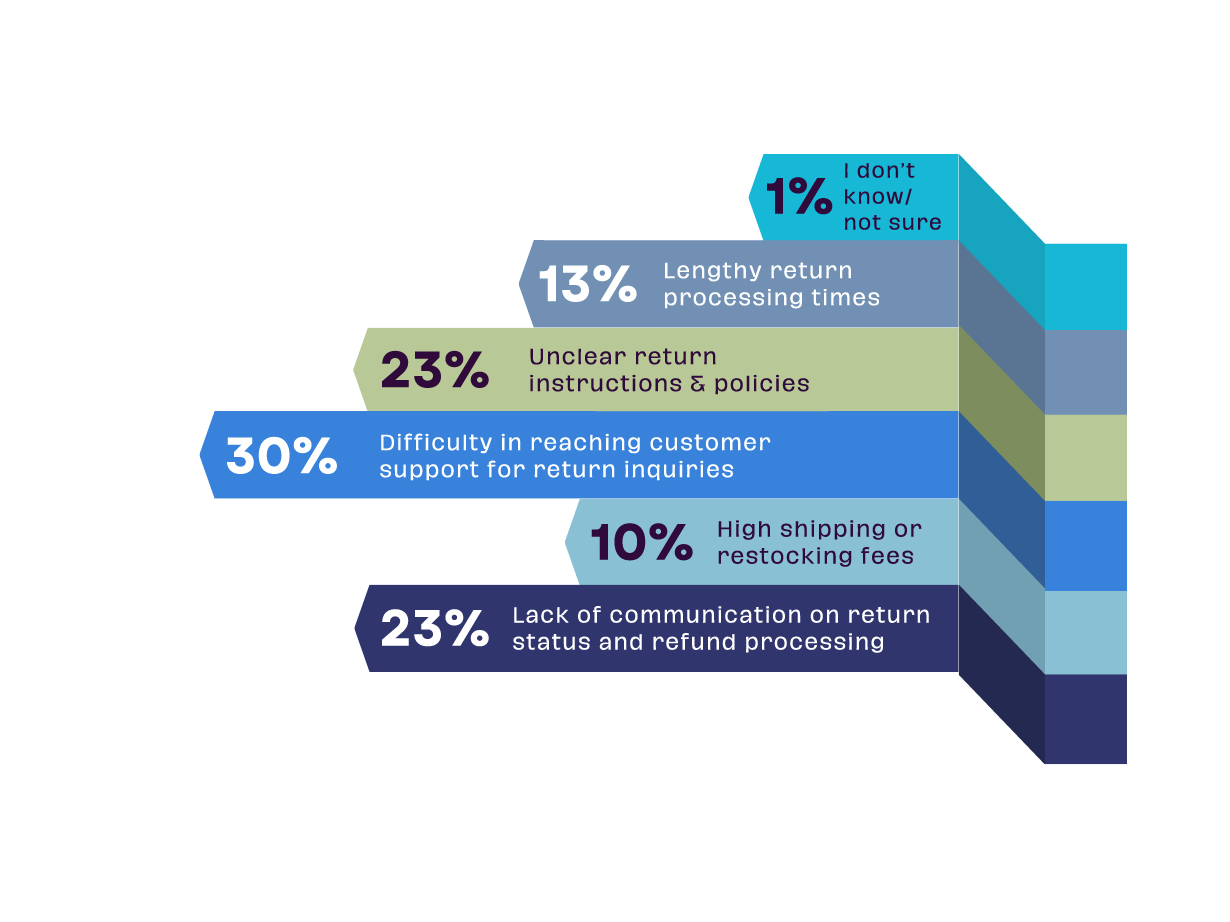
Question 15:
What is the top reason for customer dissatisfaction with the returns management process?
Communication issues seem to be the biggest concern respondents mentioned here. Notably, 23% replied that a lack of communication regarding return status and refund processing contributes to negative consumer experiences. Another 23% of those surveyed mentioned unclear return instructions and policies present challenges with reaching complete customer satisfaction.
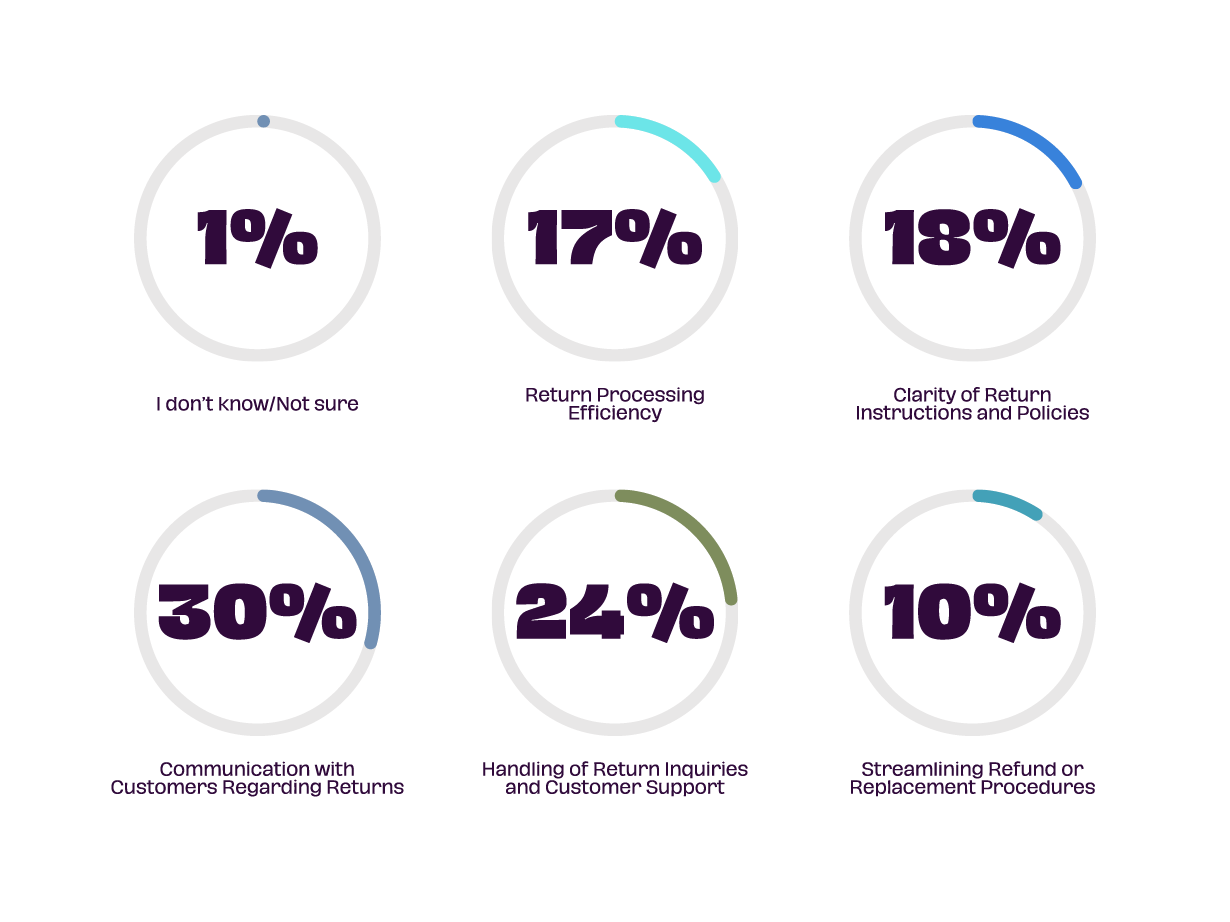
Question 16:
In your opinion, which aspect of the current returns process requires the most improvement to better serve customers and enhance satisfaction?
VARs may want to keep these past few questions, regarding customer satisfaction and communication,
in mind in future discussions with reverse logistics executives. What is holding executives back from achieving
a high rate of customer satisfaction? Yes, communication could be better, but how? Increased staff?
Better technology? Maybe the technology they have now is too expensive? The latter could prove to be true.
This idea could potentially align with the idea that many survey respondents feel they have invested too
much in their returns process. They may be investing a lot of money, and yet still not seeing the results
they’d like. After all, investing in the wrong technology and processes won’t result in ideal results, and that
may leave many executives feeling like there is no way to improve.
Question 17:
Which of the following best describes your company’s approach to handling returns?
.png) Most respondents seem to believe their company incorporates a decent amount of modern technology. 46% said their companies are adopting modern technology while complementing manual steps, while 15% said they embrace modern technology to streamline their processes. Another 25% said their companies balance modern tech and paper-based or manual methods. Only 14 total respondents indicated that their companies are reluctant to embrace modern methods, or outright prefer the ways of the past.
Most respondents seem to believe their company incorporates a decent amount of modern technology. 46% said their companies are adopting modern technology while complementing manual steps, while 15% said they embrace modern technology to streamline their processes. Another 25% said their companies balance modern tech and paper-based or manual methods. Only 14 total respondents indicated that their companies are reluctant to embrace modern methods, or outright prefer the ways of the past.
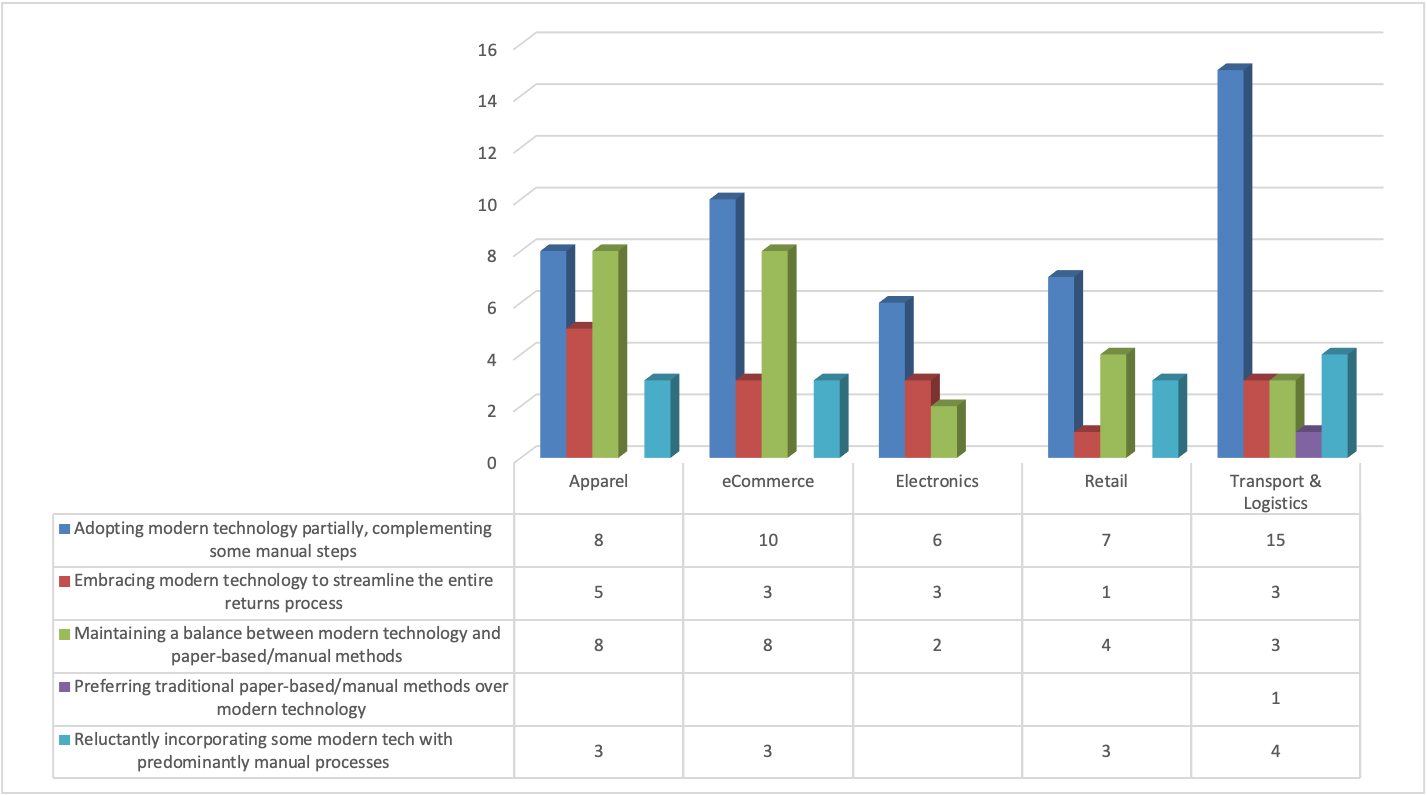
From this data, a few observations can be made:
Hybrid Approach Dominates: Across these industries, a common trend is adopting a hybrid approach, where modern technology is combined with manual methods. This suggests that many businesses recognize the value of technology but also rely on traditional methods to some extent.
Resistance to Full Automation: There is notable resistance across all industries to completely replacing manual processes with modern technology. Even in industries like eCommerce and Electronics, where technology adoption is significant, there is a preference for hybrid solutions rather than fully automated processes. The only exception here may be the electronics industry, where 25% of its respondents indicated higher reliability on modern methods to streamline returns.
Limited Preference for Traditional Methods: None of the respondents in any industry preferred traditional paper-based/manual methods over modern technology. This indicates a general acceptance of technology's role in improving efficiency, even if it's not fully replacing manual methods.
Similar Adoption Patterns: The patterns of adopting modern technology partially, balancing it with manual methods, or using it to streamline specific processes are consistent across all industries surveyed.
Question 18:
How many full-time employees are dedicated strictly to your returns processes?
.png?width=1024&height=768&name=Q22(1).png)
Question 19:
How many part-time employees are dedicated strictly to your returns processes?
The executives surveyed seemed to invest a good amount into employing both full-time and part-time employees to focus strictly on their returns processes. Interestingly, larger companies seemed to employ fewer people to focus strictly on returns. This could imply that those companies invest more in advanced technology, such as robotics to automate their processes.
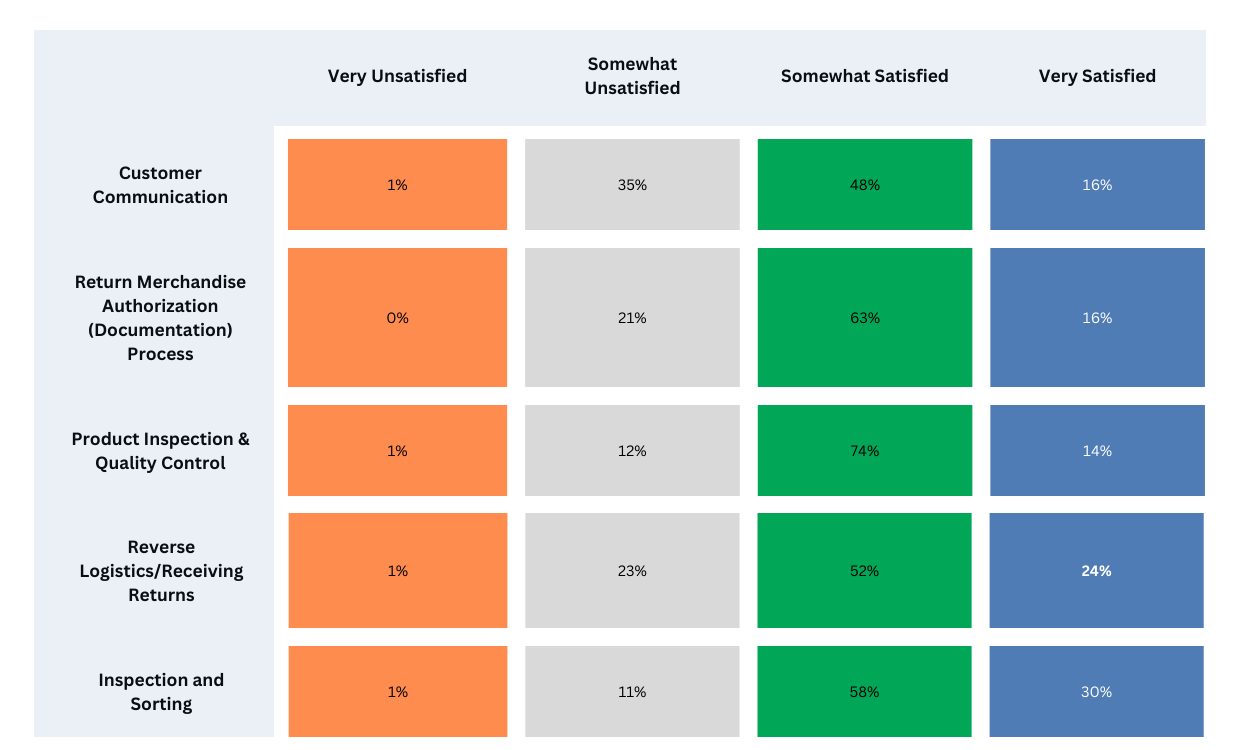
Question 20:
How do you feel about each of the following aspects of your return management process?
Very few respondents answered "very satisfied," in any area of their return management process. Customer communication again stood out as an area where executives seem to have concerns, and receiving was rated with a less than satisfactory score here as well.
In Summary
The survey data offers a small window into the dynamic landscape of returns management across industries and company sizes. While it’s clear returns processes are often shaped by industry-specific factors, many common themes and considerations emerged, including the following:
1. Consistent Challenges Across Industries: Regardless of the sector, businesses face consistent challenges, such as items being damaged or lost during transit, human errors, and technology-related issues. This universal struggle emphasizes the need for adaptable solutions that cut across industries.
2. Hybrid Approach to Technology Adoption: The prevailing trend in returns management is a hybrid approach. While modern technology is integrated, it doesn’t replace manual methods entirely. This blend of technology and traditional practices is a common theme, showcasing a practical perspective in dealing with operational complexities.
3. Customer Dissatisfaction and Communication Issues: Speaking of unhappy customers, a significant concern across businesses is customer dissatisfaction, primarily stemming from communication problems. This highlights a crucial area where technological interventions can significantly enhance customer experiences. Businesses are seeking streamlined communication channels and transparent return policies, presenting an opportunity for VARS to offer tailored solutions in this domain.
4. Resistance to Full Automation: While technology adoption is prevalent, there is notable resistance to fully automating the returns process. Businesses, even in sectors with advanced technology adoption, prefer hybrid solutions. Understanding this resistance is key, as it presents an opportunity for VARS to provide solutions that bridge the gap between traditional practices and cutting-edge technology.
5. Varied Investment Levels and Room for Improvement: Companies vary in their investments in returns management processes. Some are content, while others feel there is room for improvement. This diversity in investment levels signals the need for customized approaches. VARS can leverage this insight to offer tailored services, ensuring optimal use of technology within different budgetary constraints.
6. The Role of VARS in Bridging Technological Gaps: VARS are well-positioned to bridge the gaps identified in the survey. By offering customized, adaptable technologies that blend seamlessly with existing manual practices, VARS can cater to businesses' unique needs, ensuring streamlined returns management processes and enhanced customer satisfaction.