We surveyed 100 restaurant operators to find out about their use of displays.
We did this for one reason: to help you win more kitchen display, menu board, kiosk, and general signage deals.
Restaurants are adding screens—fast.
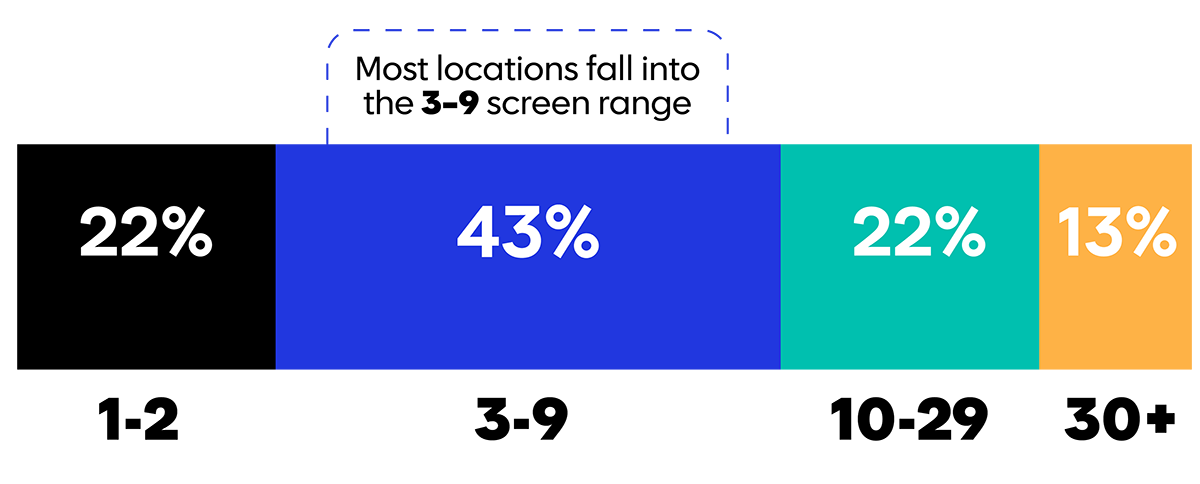
Over the last 12 months, 87% of operators increased their screen counts (65% slightly, 22% significantly). Today, the most common footprint is 3–9 screens per location (43%), with sizable cohorts running 10–29 (22%) and even 30+ (13%).
You'll be shocked to learn what percentage of those are consumer-grade vs commercial.
Hint: Keep reading—we asked. Also, thanks to Samsung for sponsoring this survey, and to VDC Research for collecting the data and providing a report of the key findings.
Number of Screens per Location
Why the Push?
When asked which outcomes matter most from tech investments, faster service/order processing (45%) came out on top—well ahead of labor reduction (16%) or minimizing order errors (16%).
Improving brand experience (28%) and operational insight (27%) are the other top factors driving in-restaurant displays.
The Hidden Culprit: Content Operations
Despite bigger fleets of screens, the #1 headache is Keeping content updated (88%).
52% of restaurants say most of their screens are consumer‑grade, and 23% say all are consumer‑grade. (!!)
Knowing this, you're probably not surprised to learn that Brightness/image issues (64%) and Frequent outages (50%) round out the top 3 pain points.

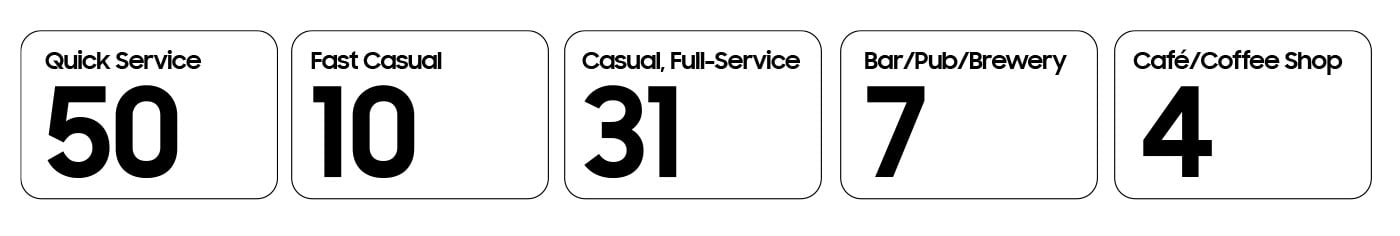
Who is in the audience?
- 50% were QSR and 31% full-service casual dining. The rest were fast casual, bar/pubs, and cafe/coffee shops.
- We heard from single-unit companies, franchises, and chains, with 89% of respondents operating less than 500 locations.
- 71% have final decision-making authority. The rest either provide recommendations or are very aware of those discussions.
| Number of Locations Operated | Count of Respondents |
| 1 | 20 |
| 2-9 | 17 |
| 10-49 | 17 |
| 50-99 | 17 |
| 100-499 | 20 |
| 500-999 | 9 |
| 1,000-4,999 | 2 |
Who You Should Be Selling To
We wanted to know who is involved in sourcing decisions, how technology decisions are handled, what kind of support they receive, and how satisfied they are with that support.
We figured these would be things you'd want to know.
Who recommends/evaluates new tech?
|
Who has final approval/budget authority?
|
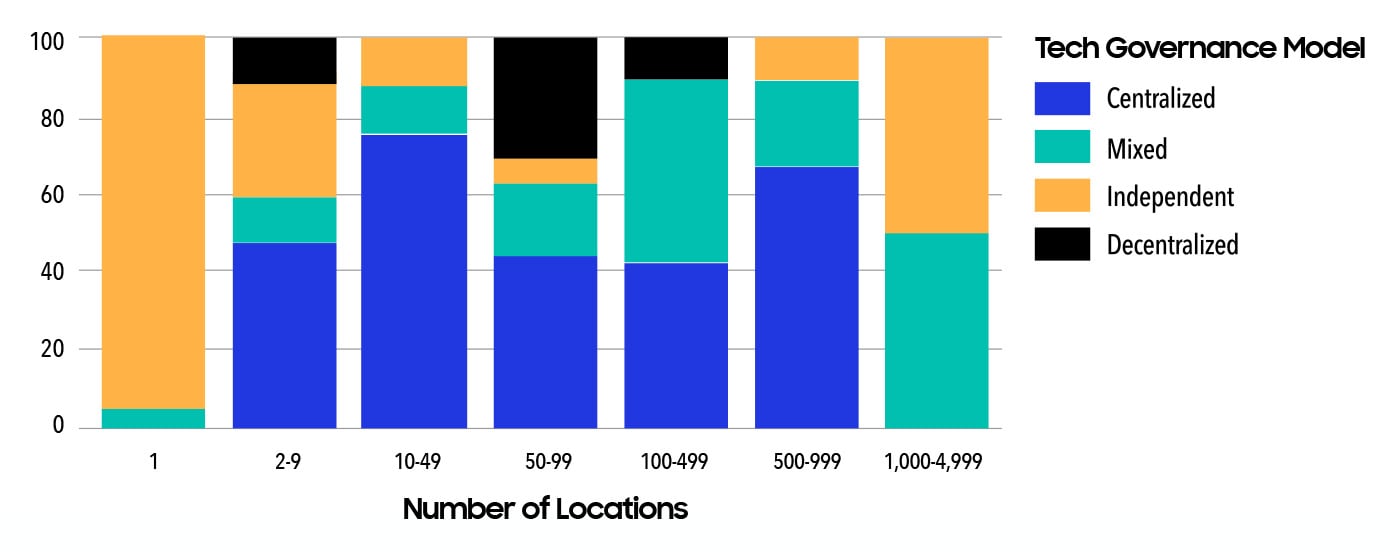
How are technology decisions made?
We learned (unsurprisingly) that single locations are overwhelmingly independent when it comes to making technological decisions. As unit counts grow, the number of Centralized and Mixed technology decision models increases.
Perhaps the two most notable pockets of opportunity exist in the 1,000+ unit organizations where operators are empowered to make Independent decisions at a high rate.
This is likely explained by the franchise operators' high level of autonomy. None of the operators that are part of a 1,000+ unit parent company are encumbered by Centralized decision-making, where many Centralized decisions cascade down in medium-sized restaurant chains, with 10-49 location companies enjoying the least autonomy.
Also notable is that nearly 30% of 50-99 location restaurants have Decentralized technology decision-making models.
Where’s the Lower-Hanging Fruit?
- Independents and decentralized buyers (39%) are often easier to close quickly if you solve a specific pain (content ops, outages, training) and offer a simple, bundled solution.
- Centralized brands (41%) offer bigger deals, but longer sales cycles—leverage references and integration strengths.
- Mixed/shared (20%) require more stakeholder management but can be lucrative if you help bridge HQ/local needs.
| Governance Model | % of Respondents | Best VAR Sales Approach | Lower Hanging Fruit? |
|
Centralized (HQ/Brand) |
41% |
Sell to HQ, standardize, rollout |
Reference wins, integration |
|
Mixed/Shared |
20% |
Facilitate consensus, flexibility |
Multi-stakeholder buy-in |
|
Independent/Local |
31% |
Speed-to-value, turnkey, local svc |
Quick wins, easy deployment |
|
Decentralized |
8% |
Local demos, risk-free pilots |
Fast closes, minimal IT reqs |
What Causes Buyers to Say 'Yes' to a Demo?
| Factor | % of Respondents |
| Recommendations from trusted peers/operators | 40% |
| Special offer (free trial/discount) | 40% |
| Peer case study | 39% |
| Clear proof of ROI/cost savings | 36% |
| Short, personalized demo for my concept | 26% |
| No-pressure educational content first | 14% |
Mapping Support Models and Satisfaction
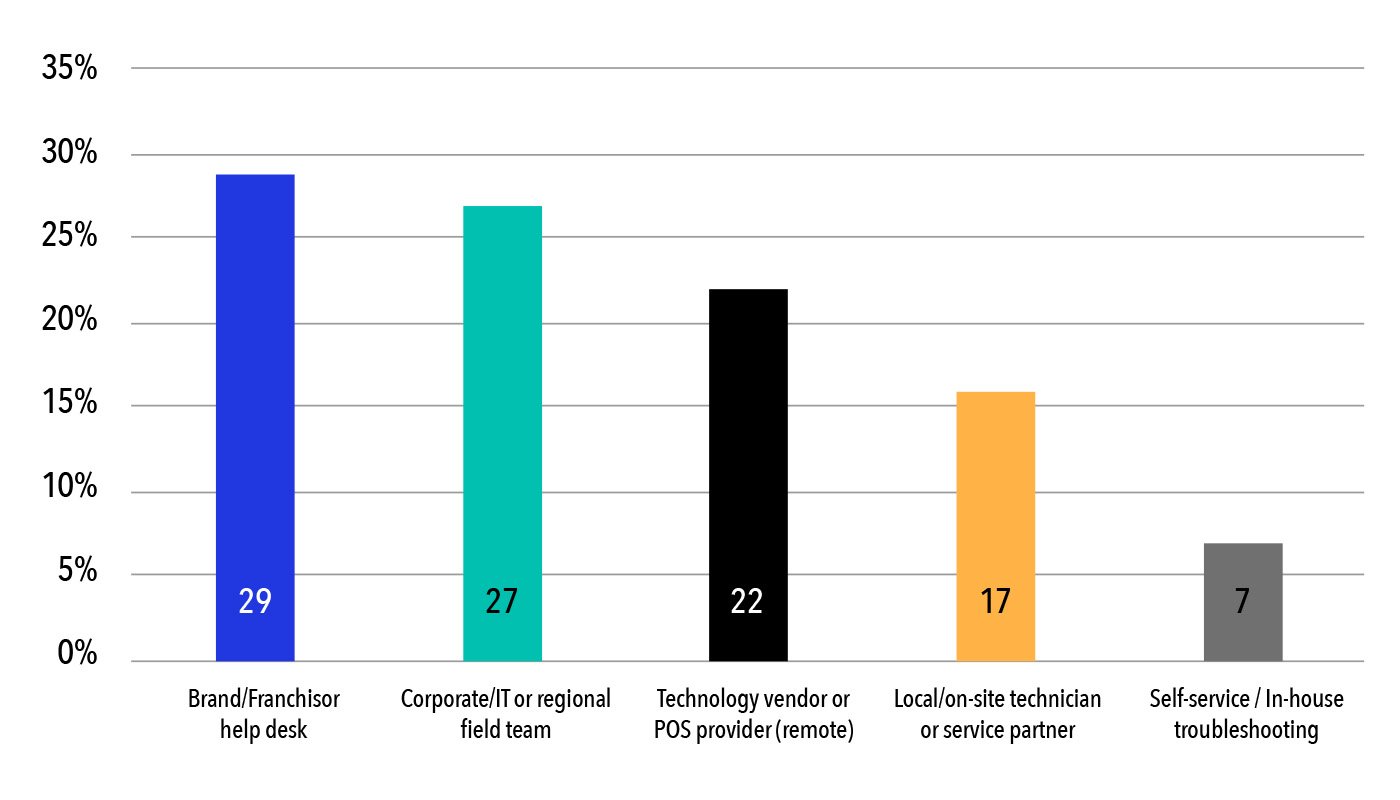
We wanted to know how restaurants are getting technology support. Nearly 1/3 of respondents (29) indicated that they get support via the Brand/Franchisor help desk. This was followed by Corporate/IT or regional field team (27), and Technology vendor or POS partner (22).
Respondents by Technology Support Model
Next, we asked how satisfied restaurants are with their support, breaking down satisfaction by support model:
Satisfaction Level by Support Model
| Support Model | Very Satisfied | Somewhat Satisfied | Neutral | Somewhat dissatisfied |
| Brand/Franchisor help desk |
24.1% | 65.5% | 6.9% | 3.4% |
| Corporate IT or regional field team | 29.6% | 63.0% | 3.7% | 3.7% |
| Technology vendor or POS vendor (remote) | 45.5% | 50.0% | 4.5% | 0.0% |
| Local/on-site technician or service partner | 12.5% | 75.0% | 0.0% | 12.5% |
| Self-service / in-house troubleshooting | 57.1% | 42.9% | 0.0% | 0.0% |
Restaurants that have the support of a Technology or POS vendor had the second highest level of Very Satisfied responses (45.5%) and a combined 'Very' and 'Somewhat' Satisfied rate of 95%—second only to those that chose Self-service / in-house troubleshooting (57.1% Very Satisfied; 100% 'Very' and 'Somewhat' combined).
It's important to note, though, that Self-service support models were reported by only 7 of 100 respondents. Their satisfaction could be a case of pride in one's self-reliance for smaller operators.
How much do different factors matter when it comes to displays?
| Factor | Very Important | Important | Somewhat Important | Not Important |
| Brand | 53% | 35% | 8% | 4% |
| Price | 53% | 37% | 7% | 2% |
| Warranty/Support options | 51% | 40% | 8% | 0% |
| Durability / Reliability | 51% | 35% | 12% | 2% |
| Integration with POS/Systems | 39% | 49% | 12% | 0% |
| Energy efficiency | 42% | 44% | 10% | 4% |
| Interactivity / touch screens | 51% | 38% | 10% | 1% |
| Ability to create/manage content | 47% | 43% | 7% | 2% |
Brand Loyalty
Barriers to Technology Adoption in Restaurants
We wanted to know what kept restaurants from making technology decisions.
We learned that across ownership types, too many vendor/technology options are a top barrier. This is an important note for VARs, as it should dictate that their approach to restaurants is unbiased and agnostic—helping the operator to navigate options while making strategic recommendations.
Staff training/adoption challenges are most prevalent amongst single-location independents and franchises.
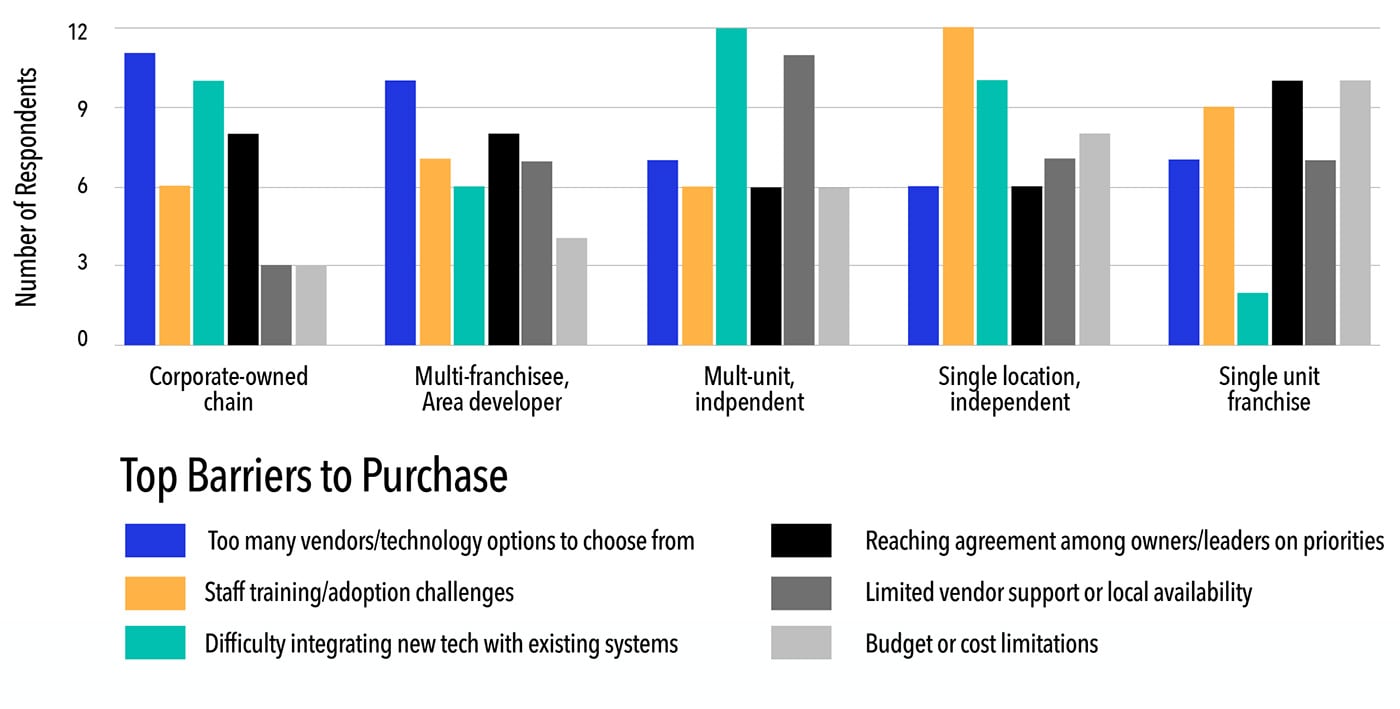
Difficulty integrating new tech with existing systems and Limited vendor support/local availability were especially acute for Multi-unit independents.
Reaching agreement among owners/leaders on priorities—a common buying slowdown across industries—is most pronounced for single-unit franchises and corporate-owned chains.
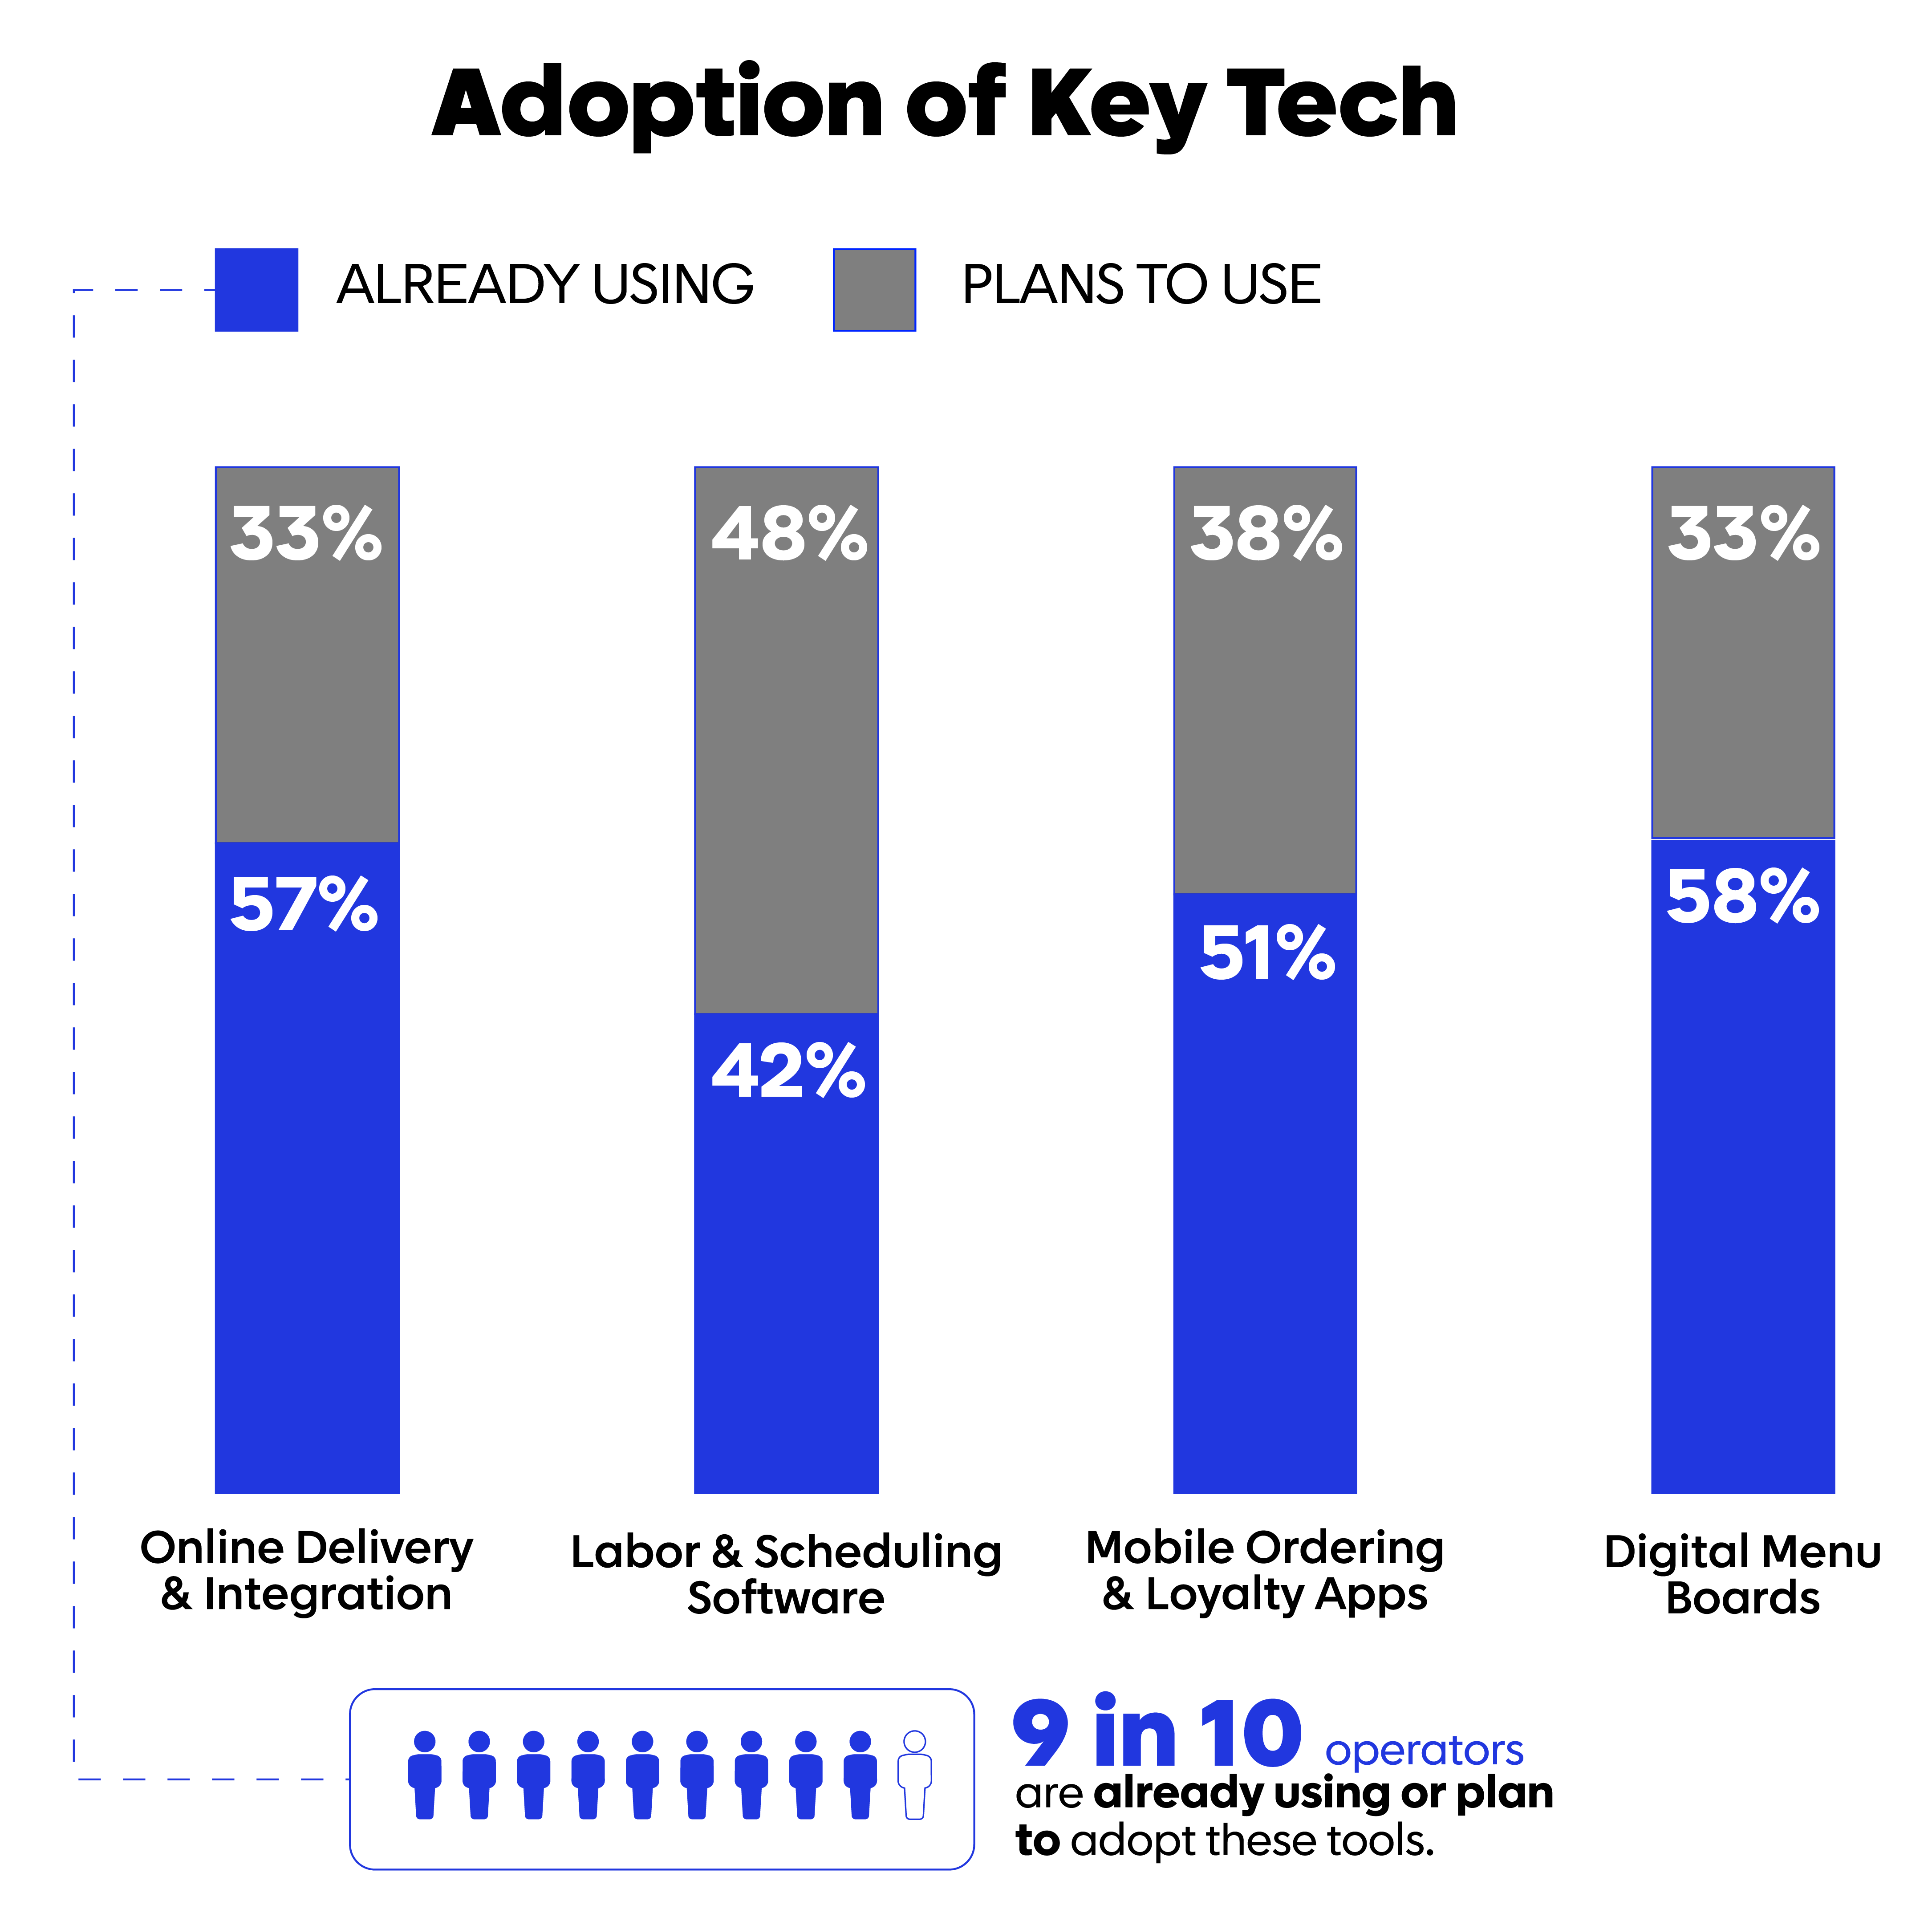
Attitudes Towards Emerging Technologies & AI
Around 90% of respondents are already using, or plan to use, technologies such as Online Delivery & Integration, Labor & Scheduling Software, Mobile Ordering & Mobile Apps, and Digital Menu Boards.
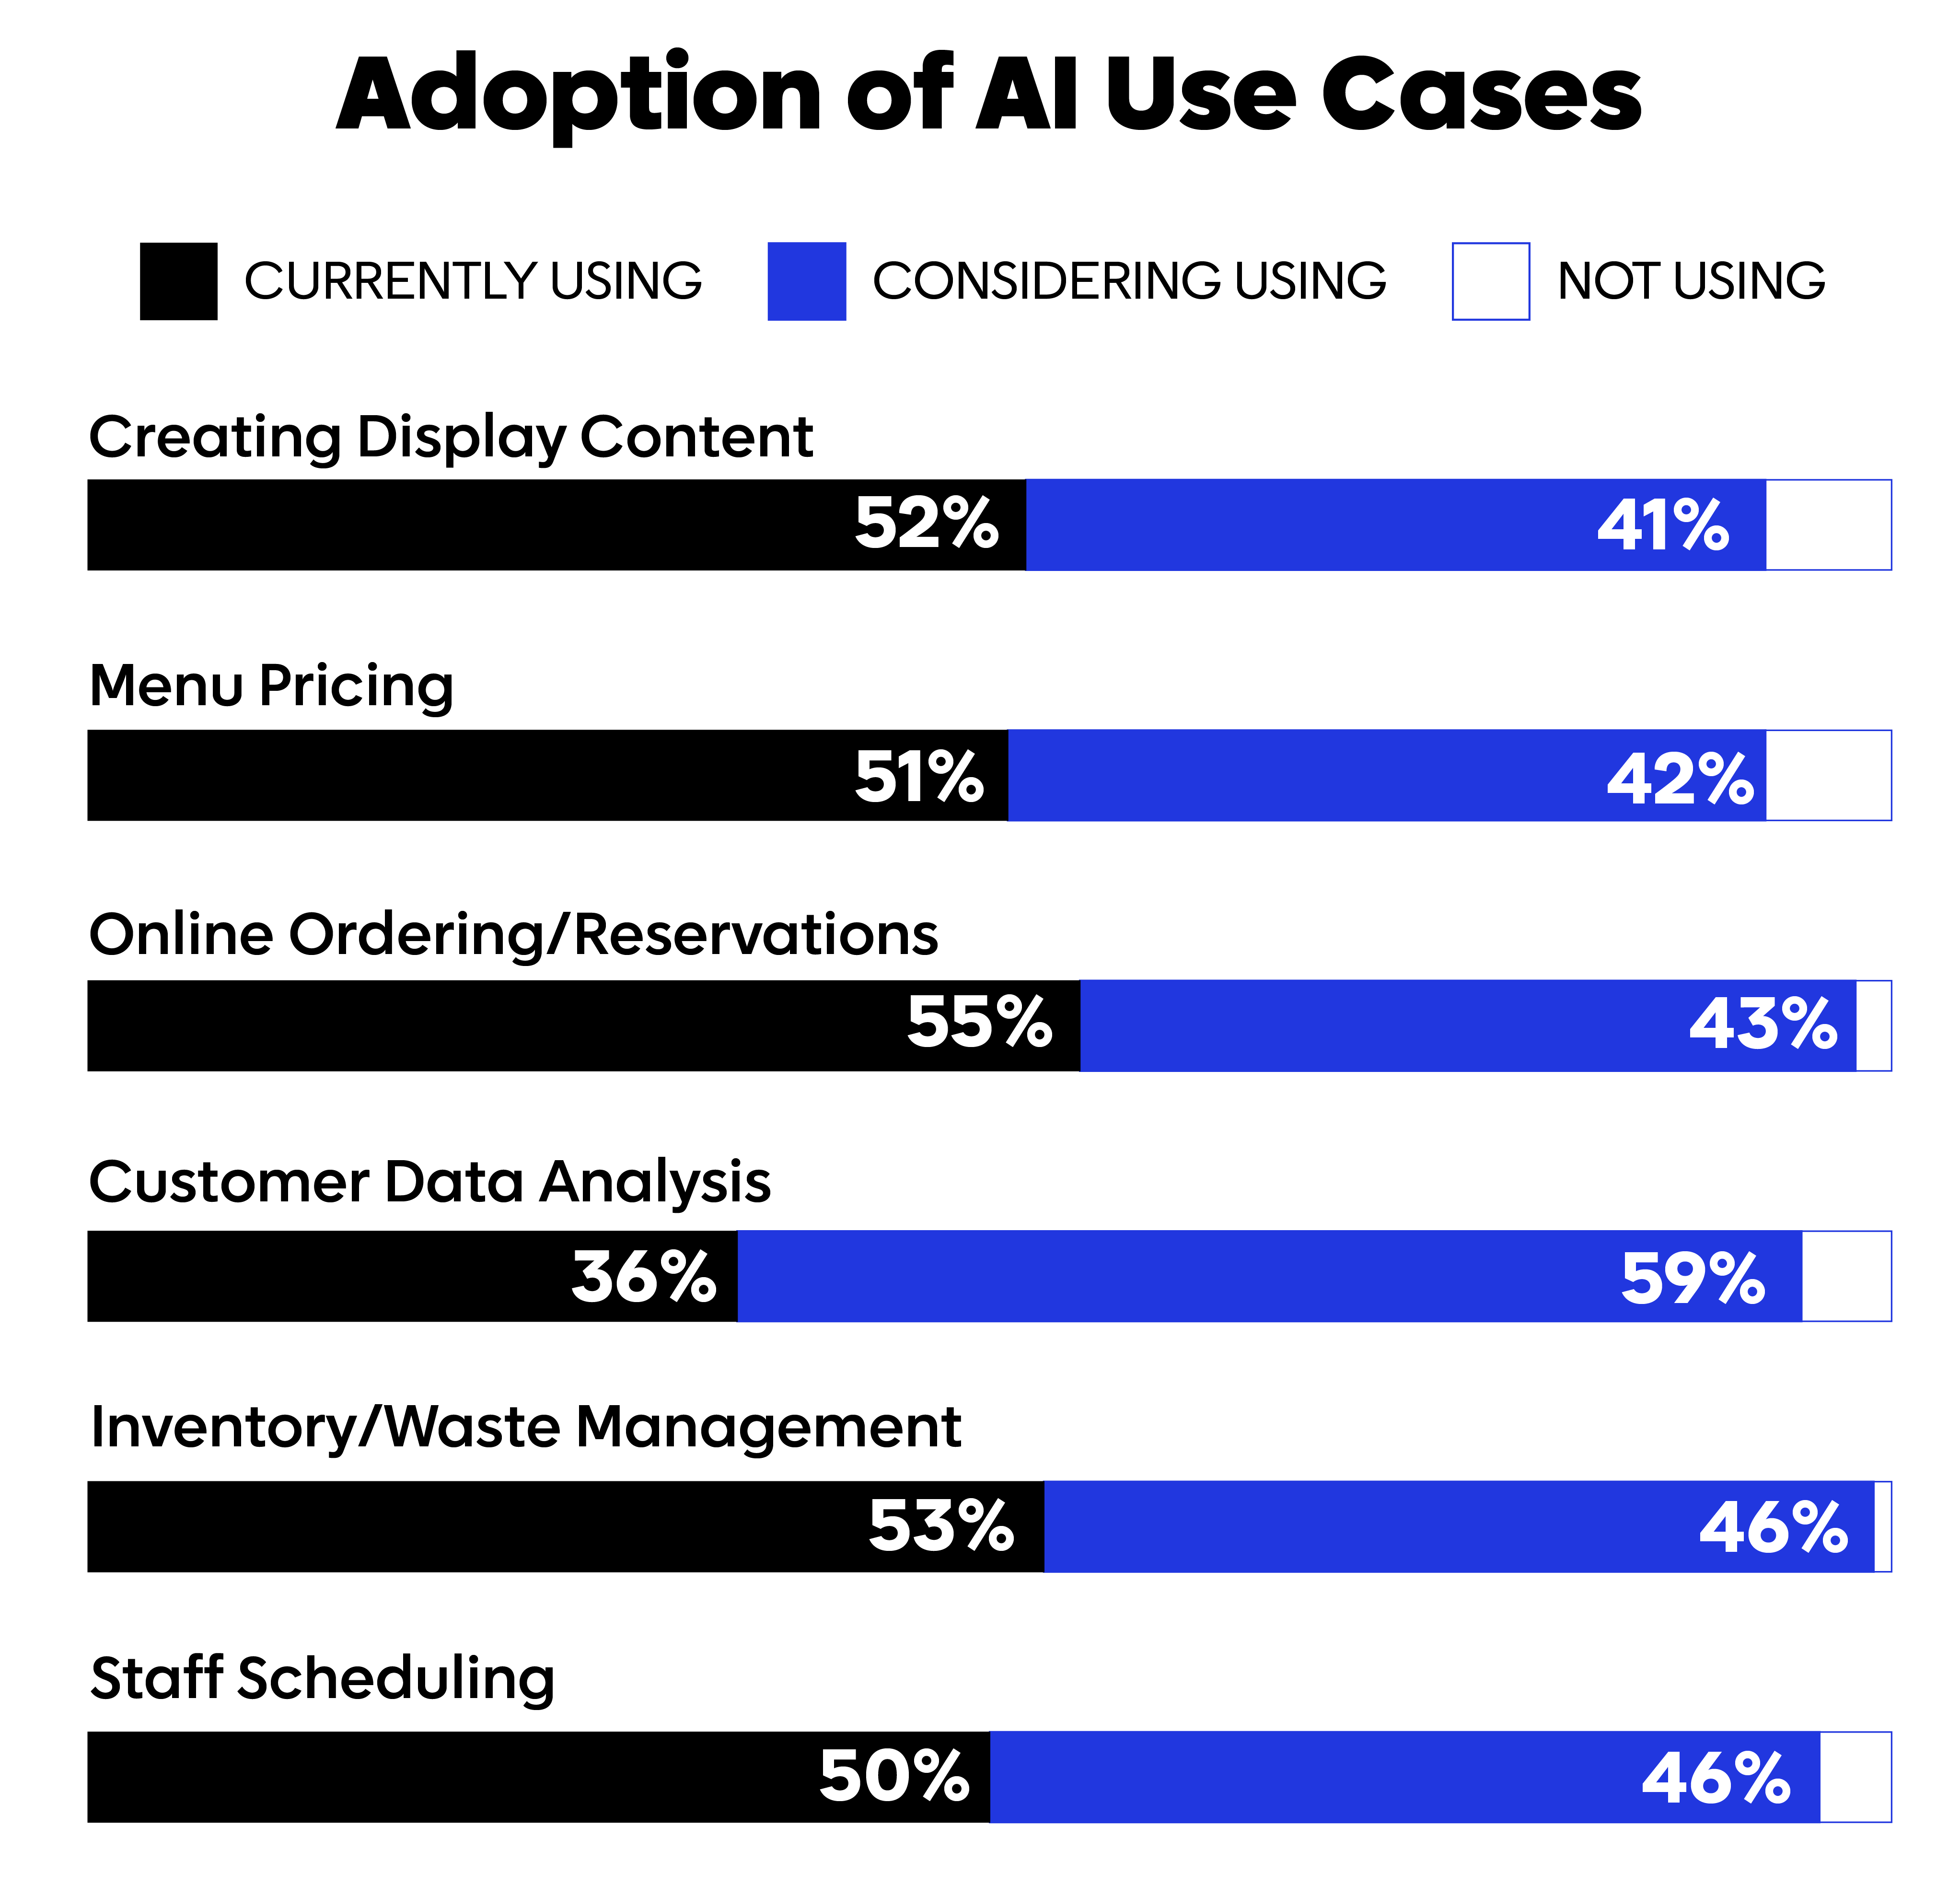
They're also fully invested or interested in AI-powered solutions, which means you should be, too!
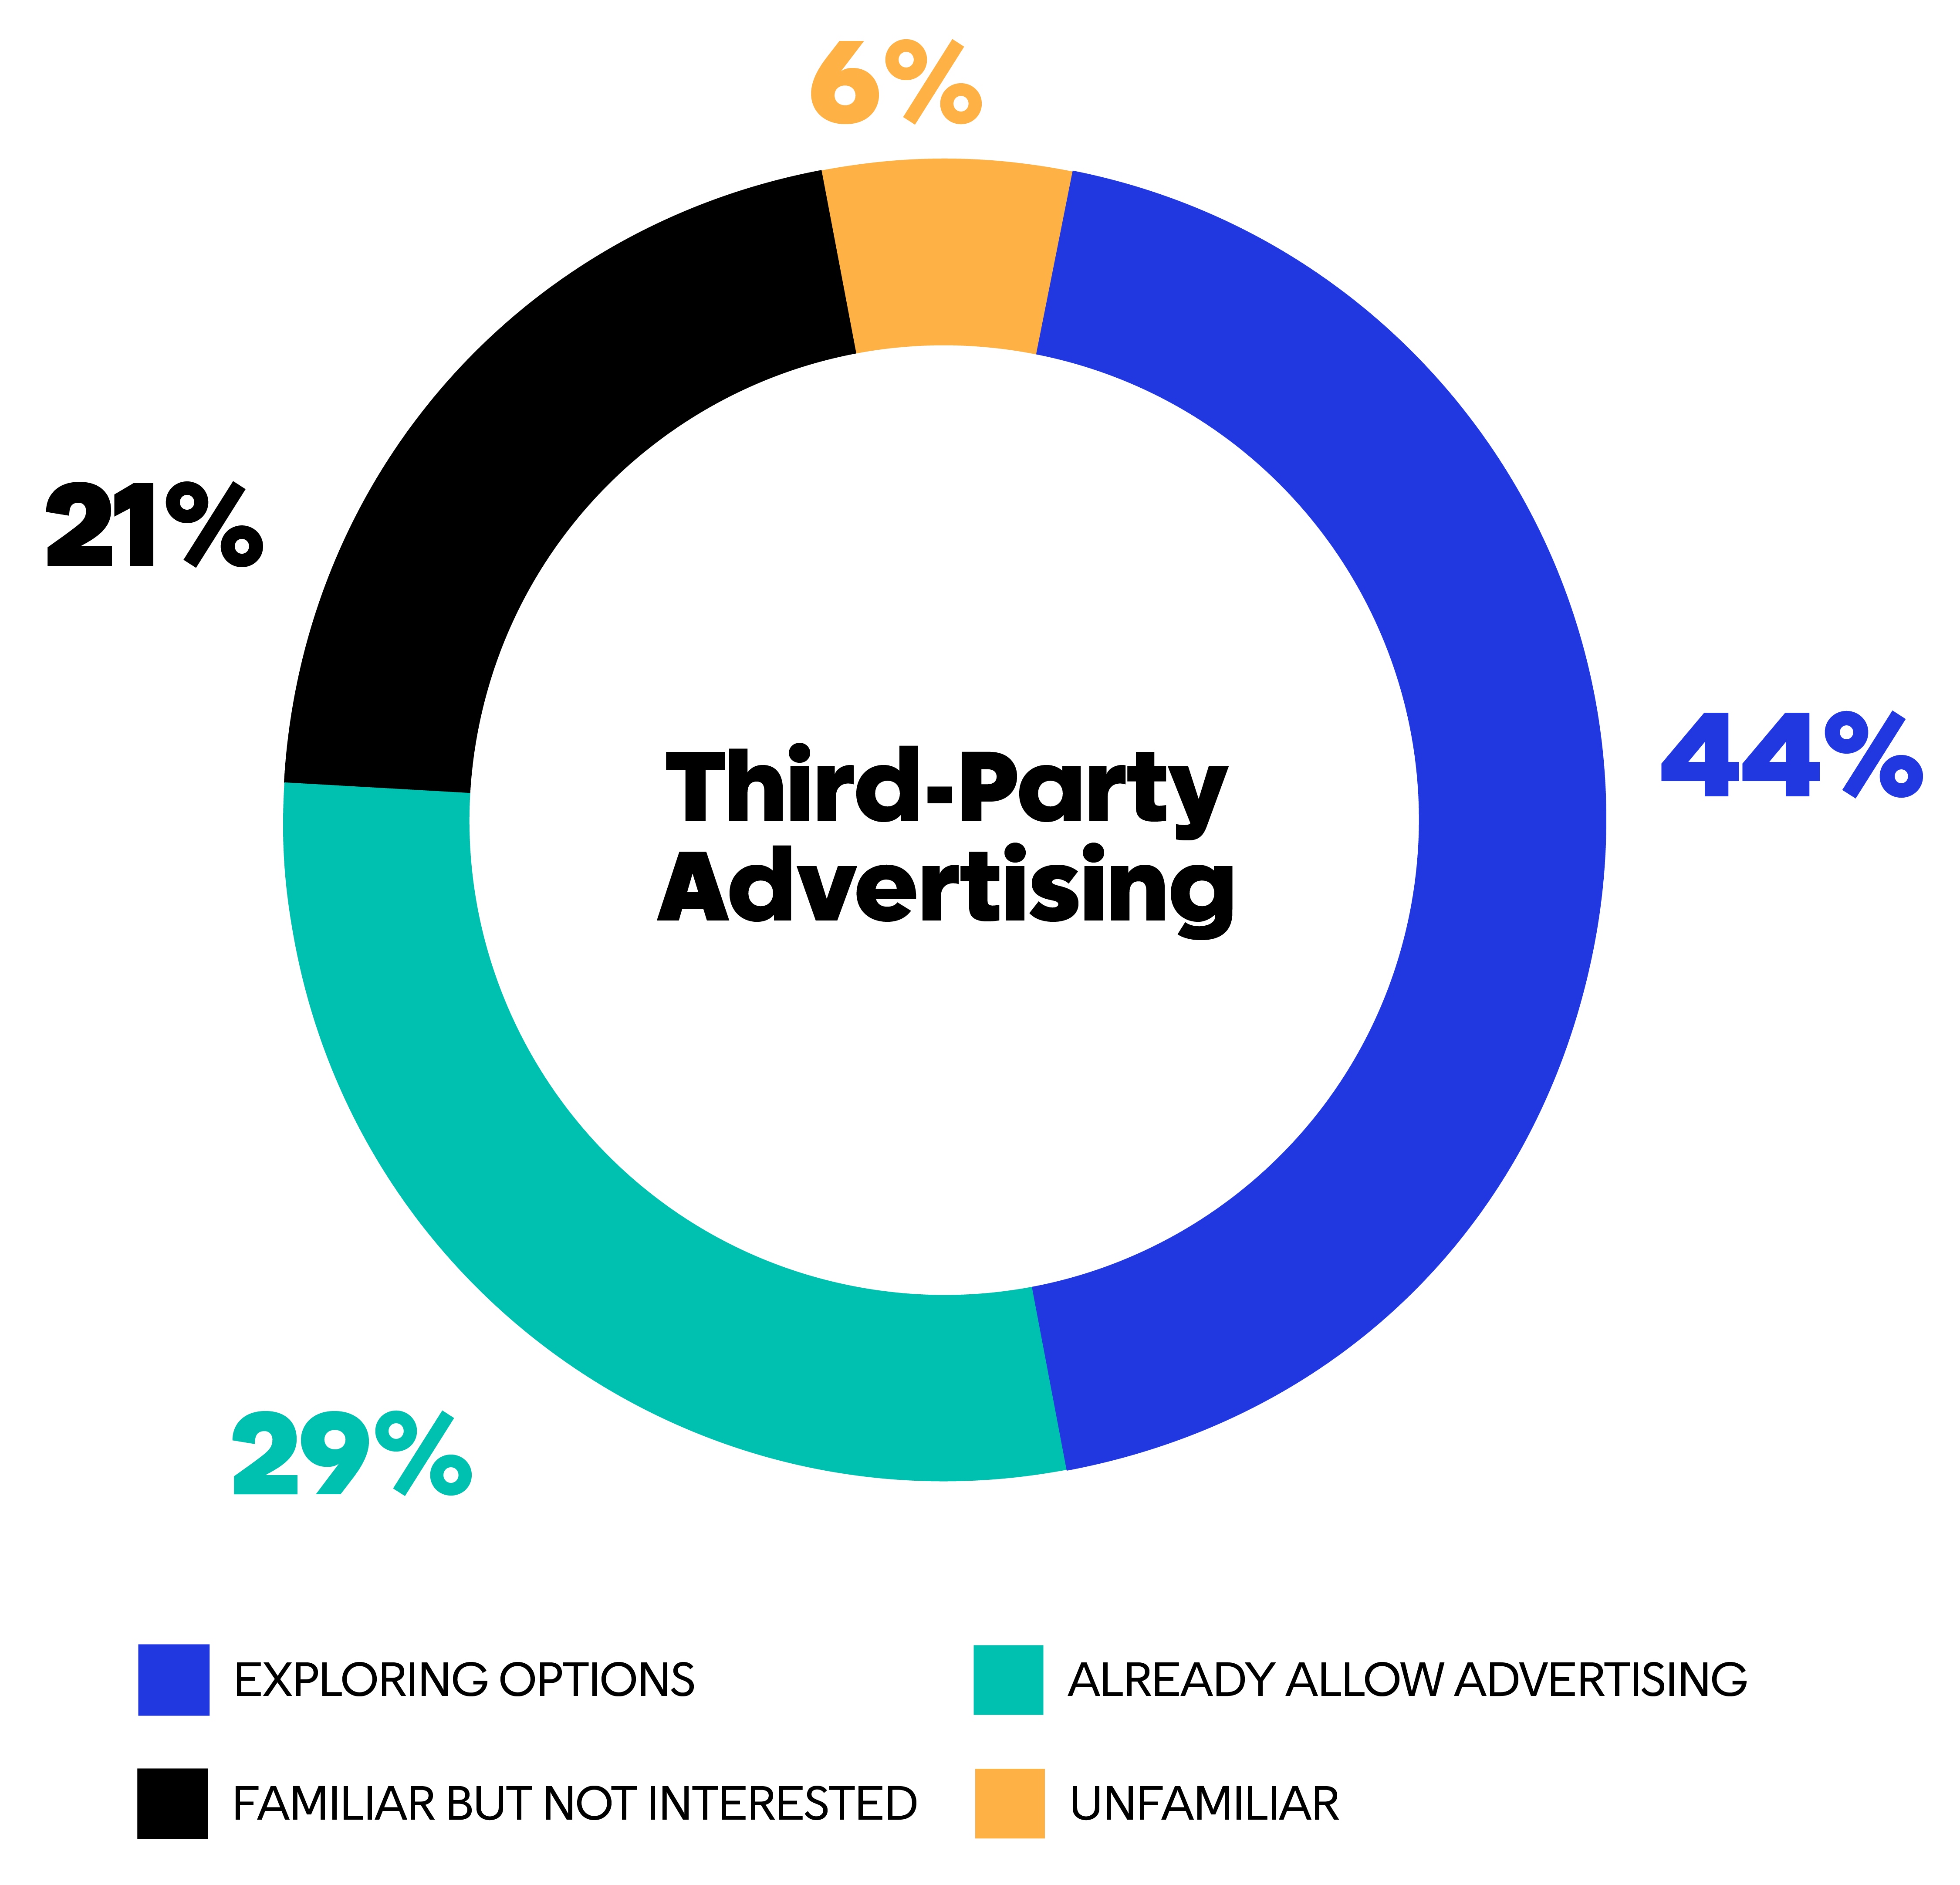
Third-Party Advertising as a Revenue Stream
Roughly 3 in 10 operators say they already allow third-party advertising on their displays.
This suggests a growing openness to ad-supported models, where digital displays help generate incremental revenue or subsidize tech costs. The interest is concentrated among fast casual/bar/café and quick service, where higher traffic can make ad models more effective.
Key Takeaways—How You Can Win Deals:
Solve the Content Problem
Restaurants struggle to keep content updated across locations—whether this is a technology or creative shortcoming—it can help get your foot in the door.
Lead with speed outcomes
Frame projects around order throughput, dwell time, and drive‑thru cycle time, not just display specs. Provide ROI calculators tied to labor reallocation and ticket velocity.
Package commercial-grade displays + CMS + Support
Solve brightness, uptime, and warranty with commercial panels; solve the #1 pain—content ops—with a CMS bundle that automates dayparting, pricing rules, and multi‑site approvals. Offer training to address adoption challenges (40%). (Chart: “Biggest challenges”)
Reduce vendor sprawl
Reduce vendor sprawl—be the integrator. Standardize stacks: POS + menu boards + kiosks + online ordering + analytics. Publish tested integration maps and SLAs. This directly addresses barriers such as too many options (41%) and integration difficulty (39%).
Enable Proof Quickly
Buyers say they’ll take demos when they see trusted peer recommendations (40%), special offers/free trials (40%), and peer case studies (39%)—package all three.
Tailor your motion to governance
Centralized chains: pitch standards, rollouts, national field support, and reporting. Independents/franchisees: emphasize turnkey packages, local partners, and rapid payback. (Org map graphic)